Fig. 4
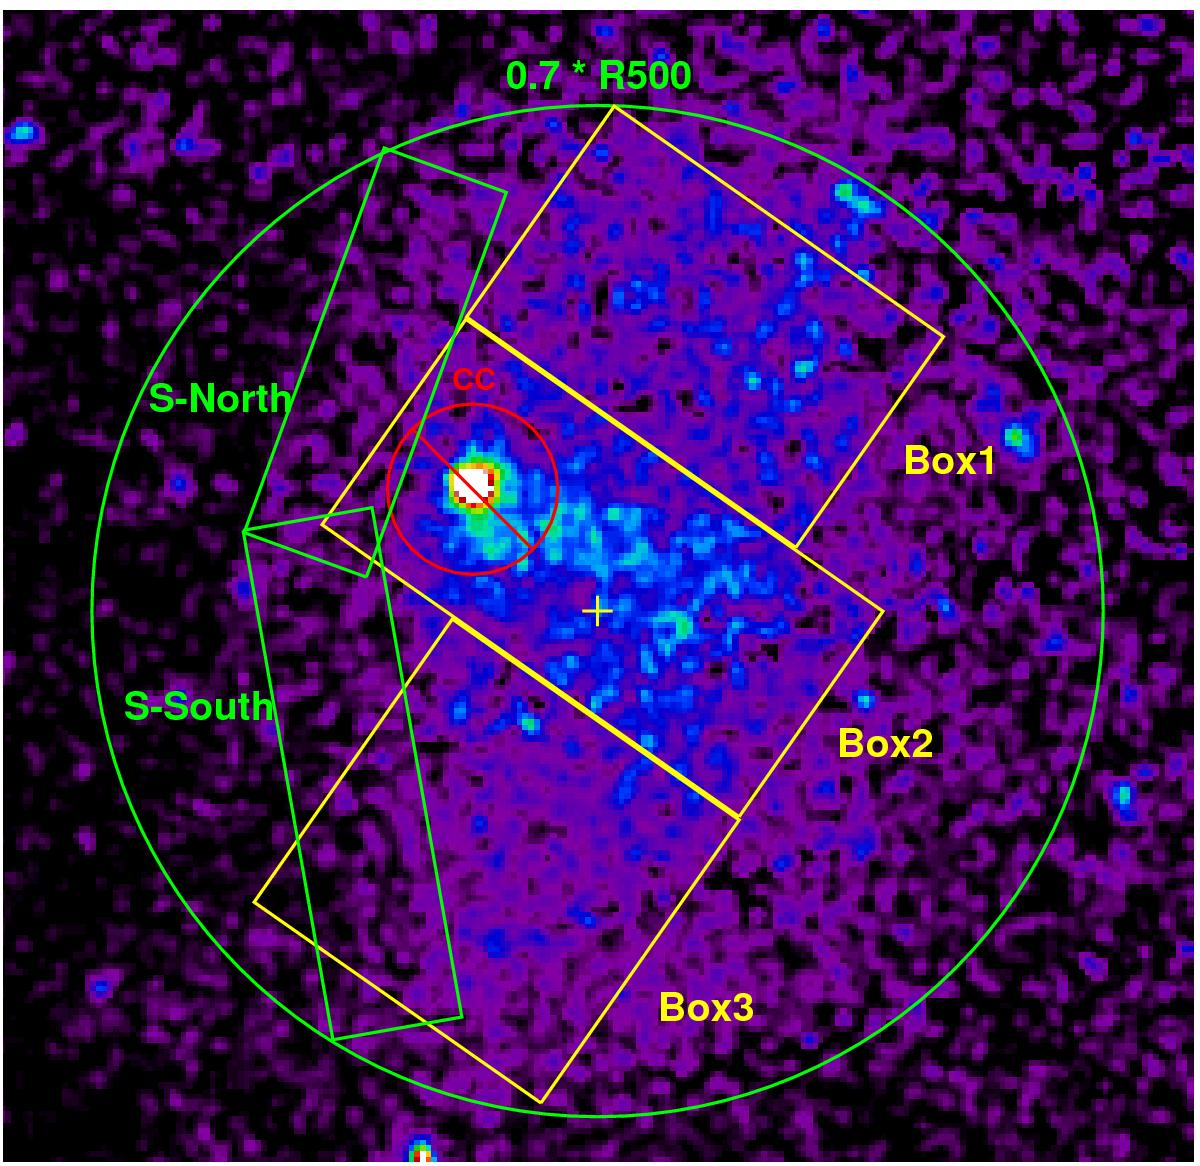
Defined regions for the spectral analysis. The central 0.7 × r500 is marked by a green circle centred at the yellow cross along with three boxes that divide the main cluster. The centre of the cluster is at 23h58m52.3s in RA and –60d37m59s in Dec. The cool component (CC) is marked by a red circle centred at the highest X-ray emission. The suspected shocked regions are enclosed by two green boxes.
Current usage metrics show cumulative count of Article Views (full-text article views including HTML views, PDF and ePub downloads, according to the available data) and Abstracts Views on Vision4Press platform.
Data correspond to usage on the plateform after 2015. The current usage metrics is available 48-96 hours after online publication and is updated daily on week days.
Initial download of the metrics may take a while.