Fig. 1
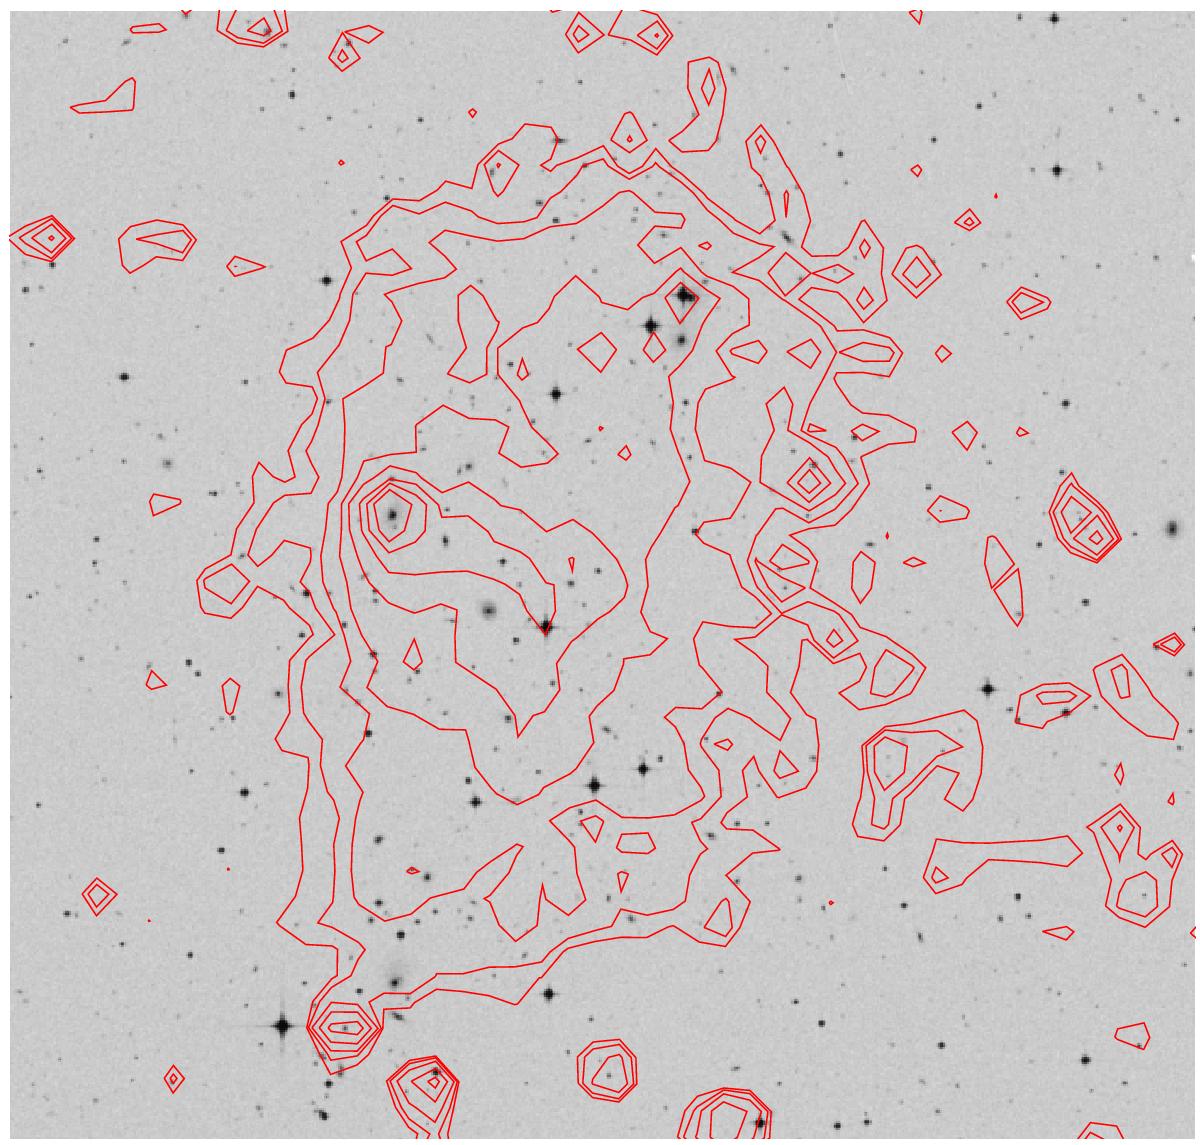
RXCJ2359.3-6042 shown in the DSS optical image overlaid with the XMM-Newton X-ray contours in the [0.5–2] keV band from the same data as in Fig. 2. The contours are obtained from a background subtracted image where the first contour traces 3 × 10⁻⁵ counts s-1 pix-1. The flux of the contours increases by steps of 1.5 subsequently. The compact component with high X-ray emission is centred at the galaxy at 23h59m04.2s in RA and –60d36m34s in Dec.
Current usage metrics show cumulative count of Article Views (full-text article views including HTML views, PDF and ePub downloads, according to the available data) and Abstracts Views on Vision4Press platform.
Data correspond to usage on the plateform after 2015. The current usage metrics is available 48-96 hours after online publication and is updated daily on week days.
Initial download of the metrics may take a while.