Fig. 3
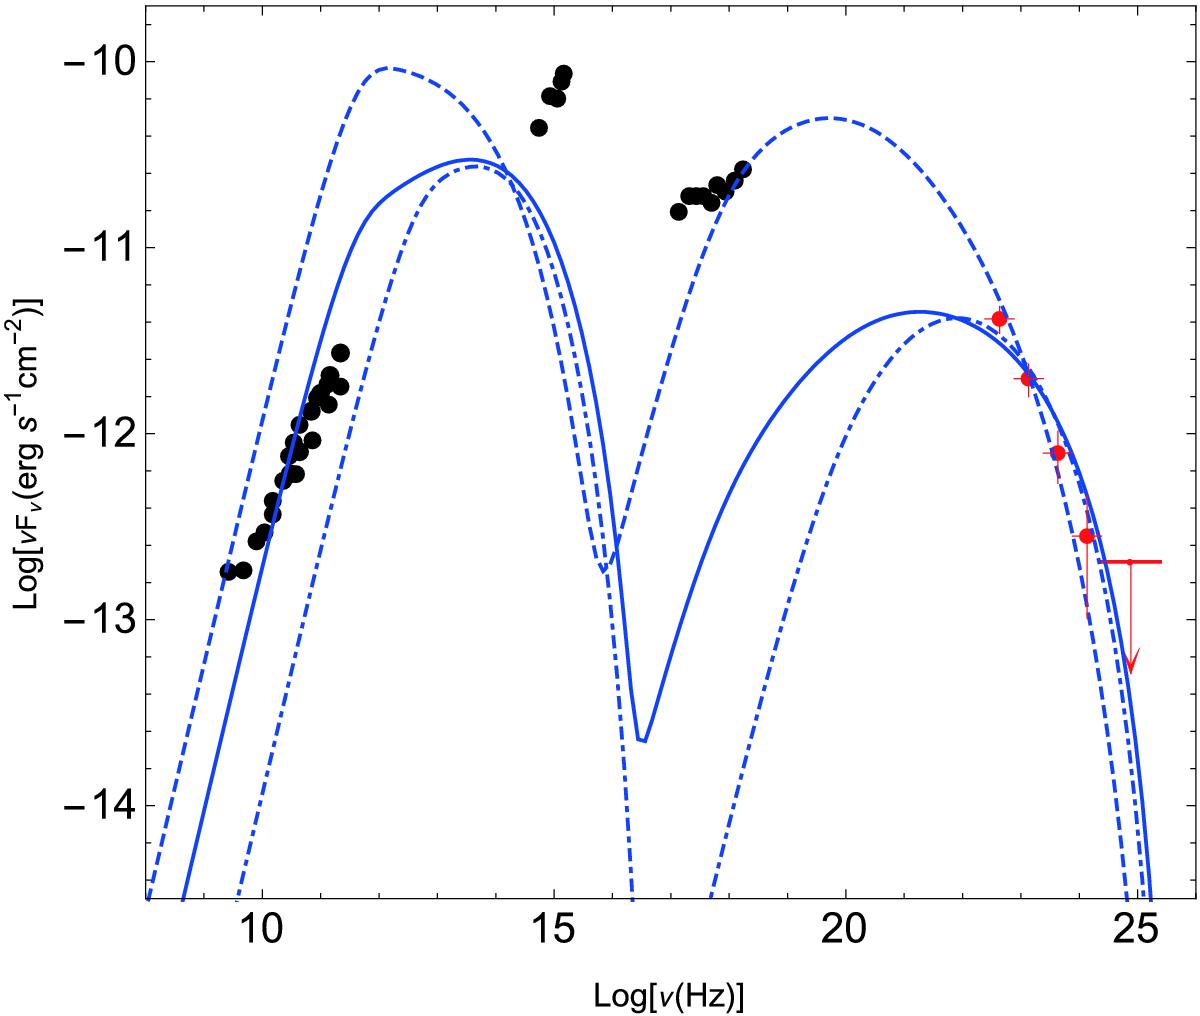
SED of 3C 120 modeled with one-zone SSC component. Black points refers to the simultaneous (quasi-simultaneous) data from (Giommi et al. 2012) and red points from Fermi-LAT data analysis. The solid, dashed, and dot dashed lines corresponds to α = 2.4,2.8, and 2, respectively. The SSC emission is calculated using a simulator developed by Andrea Tramacere (Tramacere et al. 2011, 2009; Massaro et al. 2006) available at http://www.isdc.unige.ch/sedtool/.
Current usage metrics show cumulative count of Article Views (full-text article views including HTML views, PDF and ePub downloads, according to the available data) and Abstracts Views on Vision4Press platform.
Data correspond to usage on the plateform after 2015. The current usage metrics is available 48-96 hours after online publication and is updated daily on week days.
Initial download of the metrics may take a while.