Fig. 3
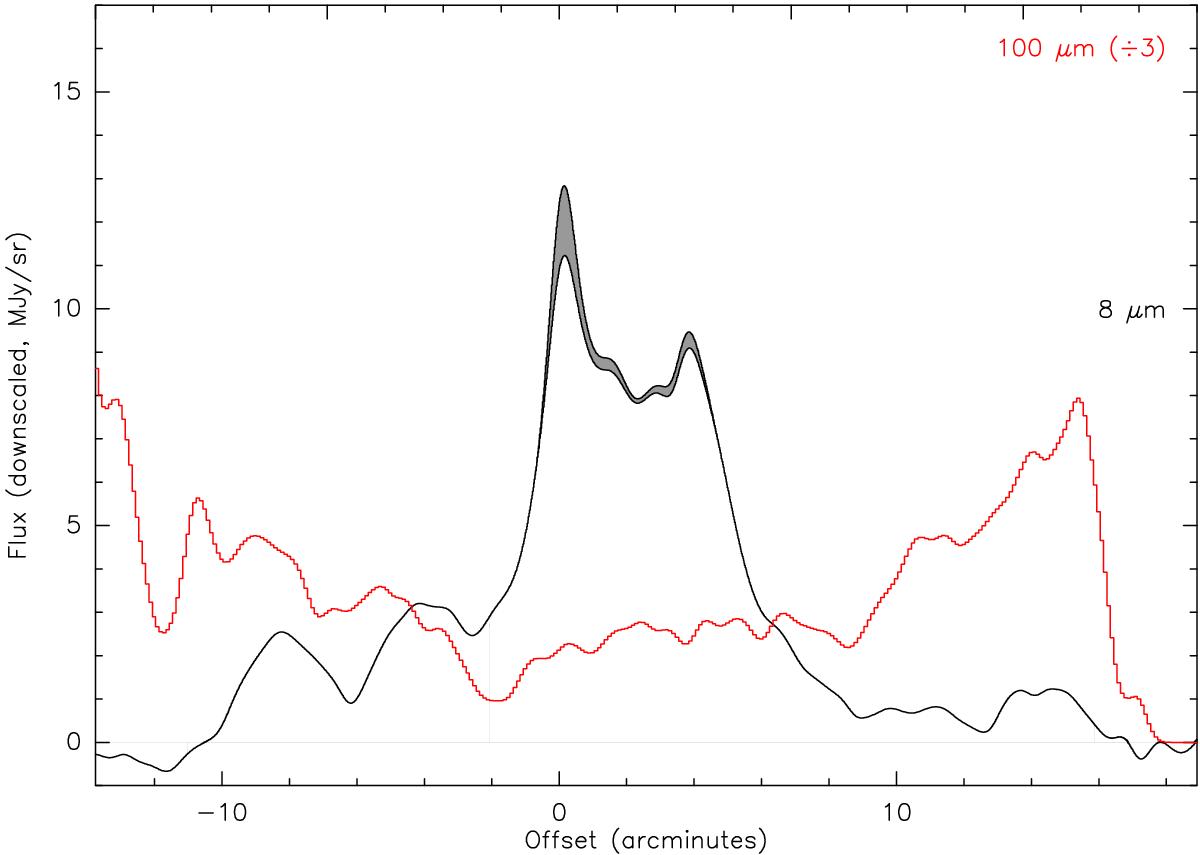
L183 cut for dust emission. This cut includes data from Herschel PACS and SPIRE, APEX/LABOCA, and IRAM-30 m/MAMBO data, all convolved to 37′′ resolution, shown one by one. The fluxes are scaled down by the amount indicated to the right of the wavelengths to align all the fluxes on the saddle point (except at 100 μm). The 8 μm opacity range is displayed (black lines filled in grey), the 250 μm is traced in blue for easier comparison with Fig. 2. Click here to change wavelength. The FIR wavelengths (except the 100 μm one) are shown together in Fig. A.1.
Current usage metrics show cumulative count of Article Views (full-text article views including HTML views, PDF and ePub downloads, according to the available data) and Abstracts Views on Vision4Press platform.
Data correspond to usage on the plateform after 2015. The current usage metrics is available 48-96 hours after online publication and is updated daily on week days.
Initial download of the metrics may take a while.