Free Access
Fig. 1
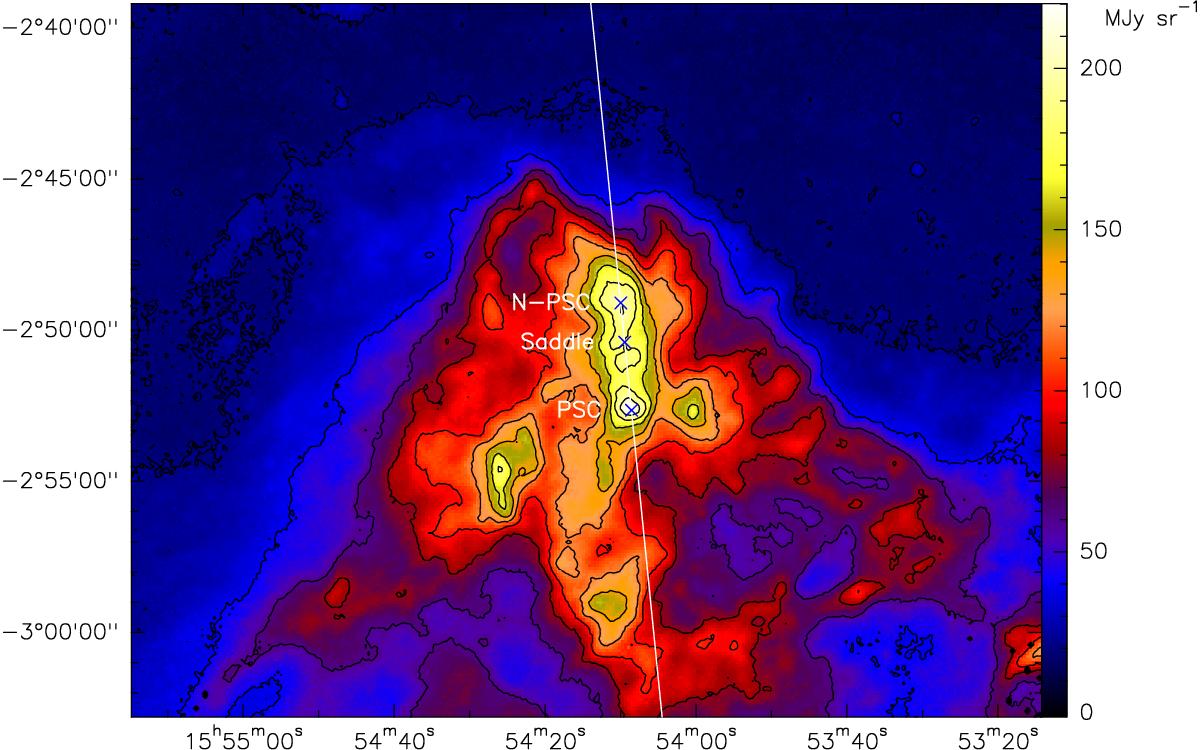
L183 Herschel/SPIRE map at 250 μm. Contour levels every 20 MJy sr-1. The cut through the region is traced as a ~6° tilted line with respect to the vertical (equatorial north) direction.
Current usage metrics show cumulative count of Article Views (full-text article views including HTML views, PDF and ePub downloads, according to the available data) and Abstracts Views on Vision4Press platform.
Data correspond to usage on the plateform after 2015. The current usage metrics is available 48-96 hours after online publication and is updated daily on week days.
Initial download of the metrics may take a while.