Fig. 6
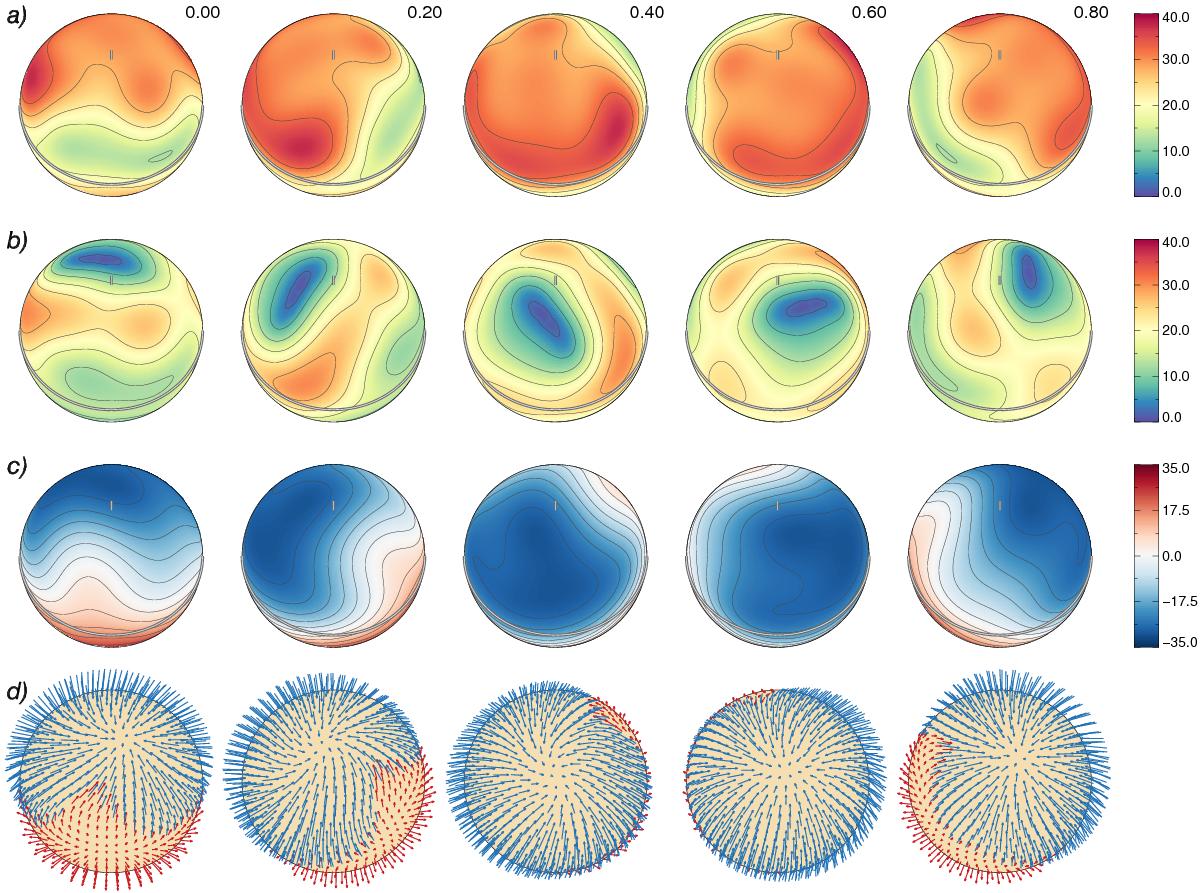
Surface magnetic field distribution of HD 75049 derived from the Stokes IV profiles of Si, Cr, and Fe lines using MDI. The star is shown at five rotational phases, which are indicated above the spherical plots, and at an inclination angle of i = 30°. The spherical plots show the maps of a) the field modulus; b) the horizontal field; c) the radial field; and d) the field orientation. The contours over spherical maps are plotted in steps of 5 kG. The thick line and the vertical bar indicate positions of the rotational equator and the pole. The colour side bars give the field strength in kG. The two different colours in the field orientation map correspond to the field vectors directed outwards (red) and inwards (blue).
Current usage metrics show cumulative count of Article Views (full-text article views including HTML views, PDF and ePub downloads, according to the available data) and Abstracts Views on Vision4Press platform.
Data correspond to usage on the plateform after 2015. The current usage metrics is available 48-96 hours after online publication and is updated daily on week days.
Initial download of the metrics may take a while.