Fig. 4
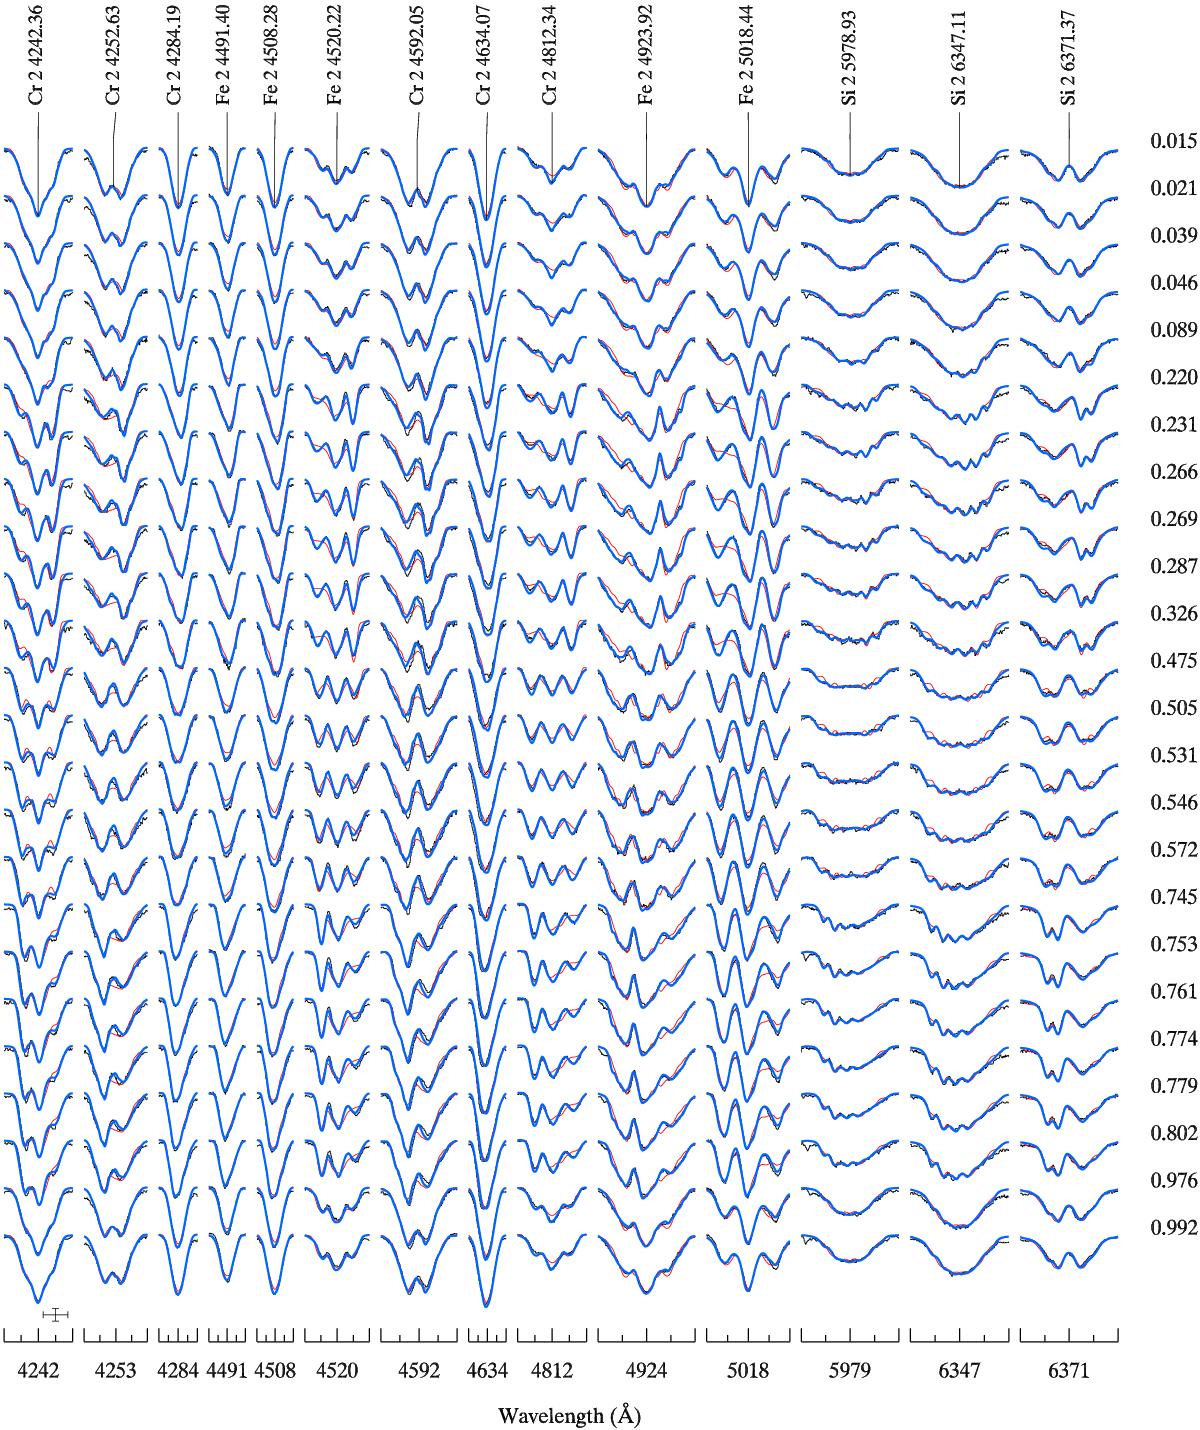
Comparison of the observed Stokes I profiles (black line) of Si, Cr, and Fe lines with the fit achieved by the magnetic inversion code using all harmonic modes with ℓ ≤ 5 (thick blue line). The thin red line illustrates an attempt to reproduce observations with a dipolar field topology. Spectra corresponding to different rotation phases are offset vertically. Rotation phases are indicated to the right of each spectrum. The error bars in the lower left corner indicate the vertical (10%) and horizontal (0.5 Å) scales.
Current usage metrics show cumulative count of Article Views (full-text article views including HTML views, PDF and ePub downloads, according to the available data) and Abstracts Views on Vision4Press platform.
Data correspond to usage on the plateform after 2015. The current usage metrics is available 48-96 hours after online publication and is updated daily on week days.
Initial download of the metrics may take a while.