Free Access
Fig. 8
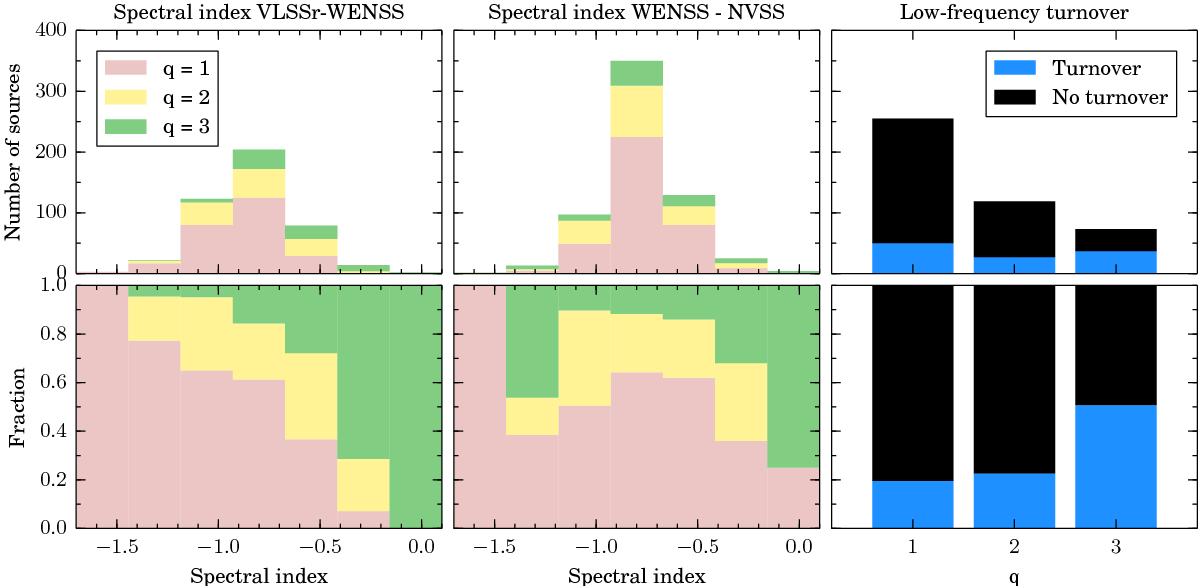
Source quality as a function of low-frequency spectral index (left panel) and high-frequency spectral index (middle panel), with absolute number of sources and percentage at each quality factor. In the right panel we show the number of sources with a given quality showing or not showing a low-frequency turnover.
Current usage metrics show cumulative count of Article Views (full-text article views including HTML views, PDF and ePub downloads, according to the available data) and Abstracts Views on Vision4Press platform.
Data correspond to usage on the plateform after 2015. The current usage metrics is available 48-96 hours after online publication and is updated daily on week days.
Initial download of the metrics may take a while.