Fig. 7
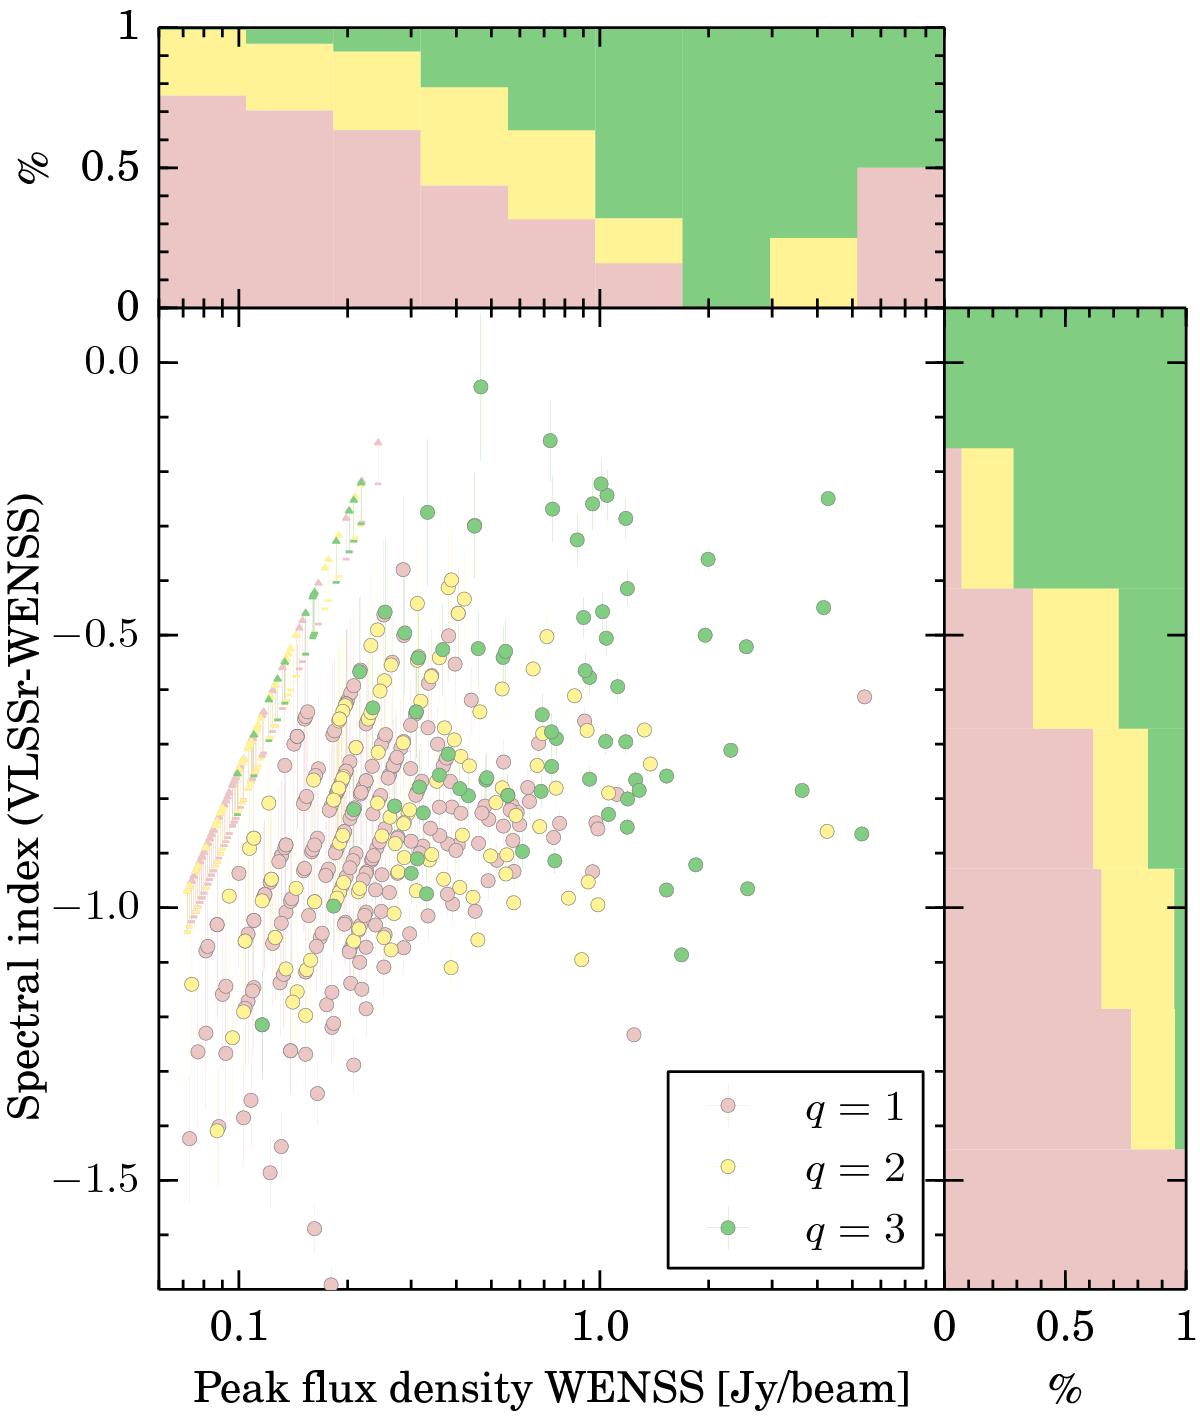
Source quality as a function of low-frequency spectral index and WENSS peak flux density. Red, yellow, and green colours represent q = 1,2, and 3, respectively. q = 3 corresponds to suitable primary calibrators. The histograms show the percentage of sources at each quality value. The histogram on the right does not include the sources with upper limits in their spectral indexes. The uncertainties of some of the values are smaller than the symbols, especially for the WENSS peak flux density. The stripes at low peak flux densities are due to sources detected at multiples of the rms noise of VLSSr.
Current usage metrics show cumulative count of Article Views (full-text article views including HTML views, PDF and ePub downloads, according to the available data) and Abstracts Views on Vision4Press platform.
Data correspond to usage on the plateform after 2015. The current usage metrics is available 48-96 hours after online publication and is updated daily on week days.
Initial download of the metrics may take a while.