Fig. 8
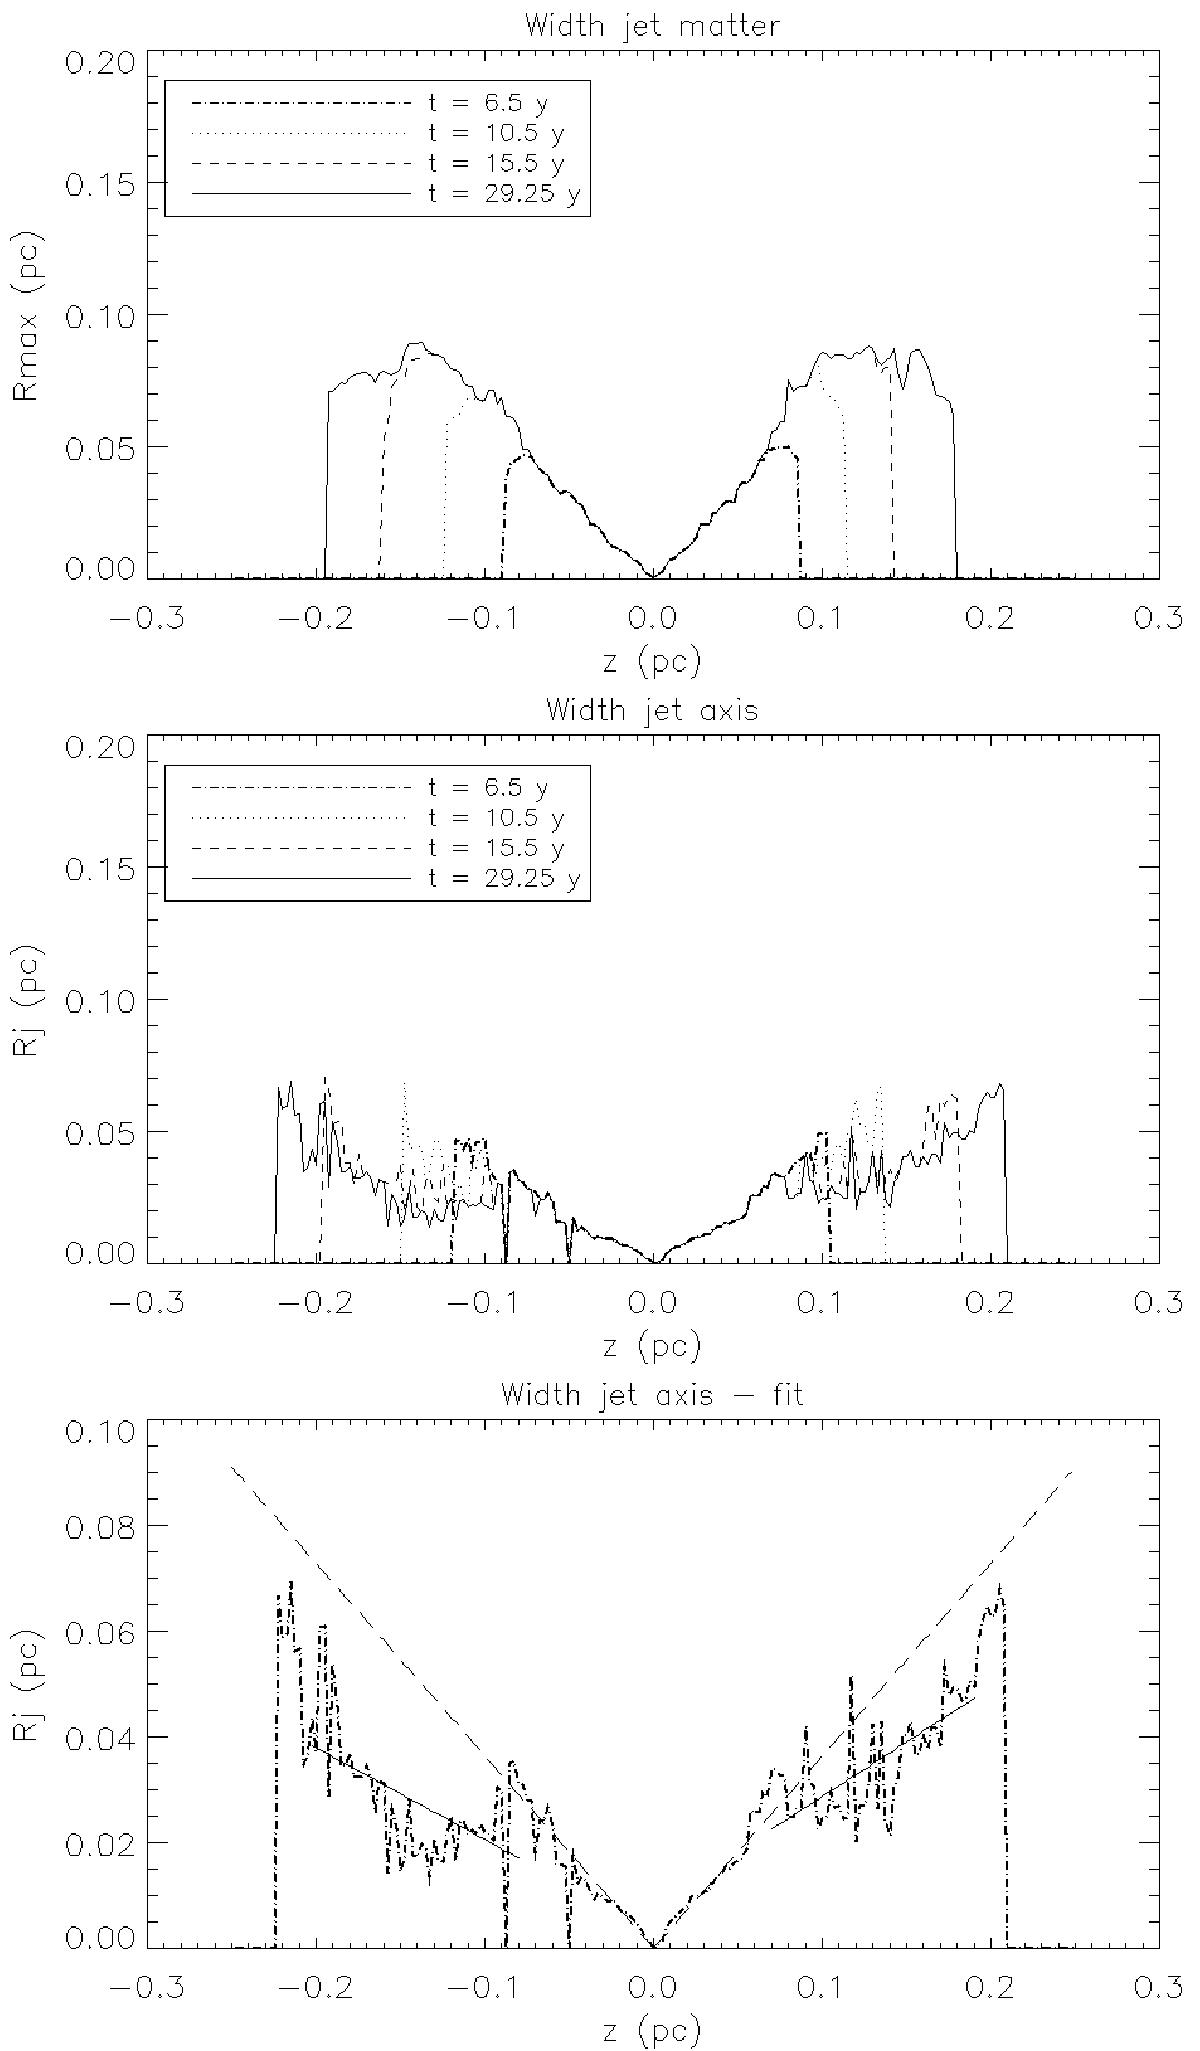
Top: maximum distance Rmax(z) from the precession axis reached by the jet material, at various times. Middle: distance Rj(z) from the precession axis of the jet beam axis, at the same times. Bottom: fit of Rj(z) for t = 29.25 years. The dashed line represents a precessing angle of 20°. The two continuous lines fits a ax+b function between the transition region (z = 0.07 pc) and the position where the jet gets deflected (z = 0.17 pc). The curve is fit for the negative z with 9.8° and the positive z with 11.6° precessing angles.
Current usage metrics show cumulative count of Article Views (full-text article views including HTML views, PDF and ePub downloads, according to the available data) and Abstracts Views on Vision4Press platform.
Data correspond to usage on the plateform after 2015. The current usage metrics is available 48-96 hours after online publication and is updated daily on week days.
Initial download of the metrics may take a while.