Fig. 1
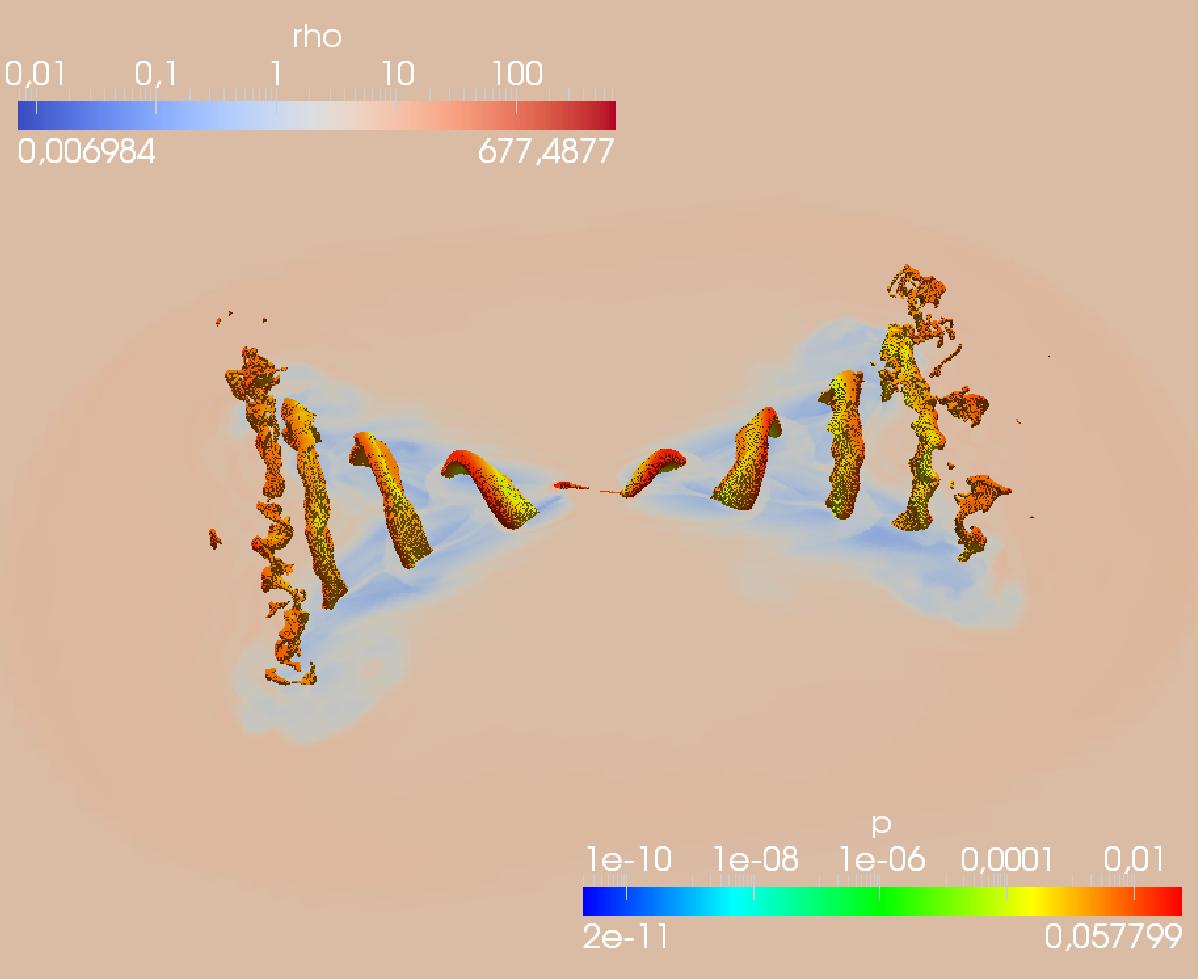
Overall view of the large simulation of SS433 zoomed to the scale reached at t = 2 (6.5 years), i.e. ![]() pc. The jet volume is rendered using the tracer to locate the jet. The jet volume is colored with the pressure. The 2D cut shows the proper density.
pc. The jet volume is rendered using the tracer to locate the jet. The jet volume is colored with the pressure. The 2D cut shows the proper density.
Current usage metrics show cumulative count of Article Views (full-text article views including HTML views, PDF and ePub downloads, according to the available data) and Abstracts Views on Vision4Press platform.
Data correspond to usage on the plateform after 2015. The current usage metrics is available 48-96 hours after online publication and is updated daily on week days.
Initial download of the metrics may take a while.