Fig. 6
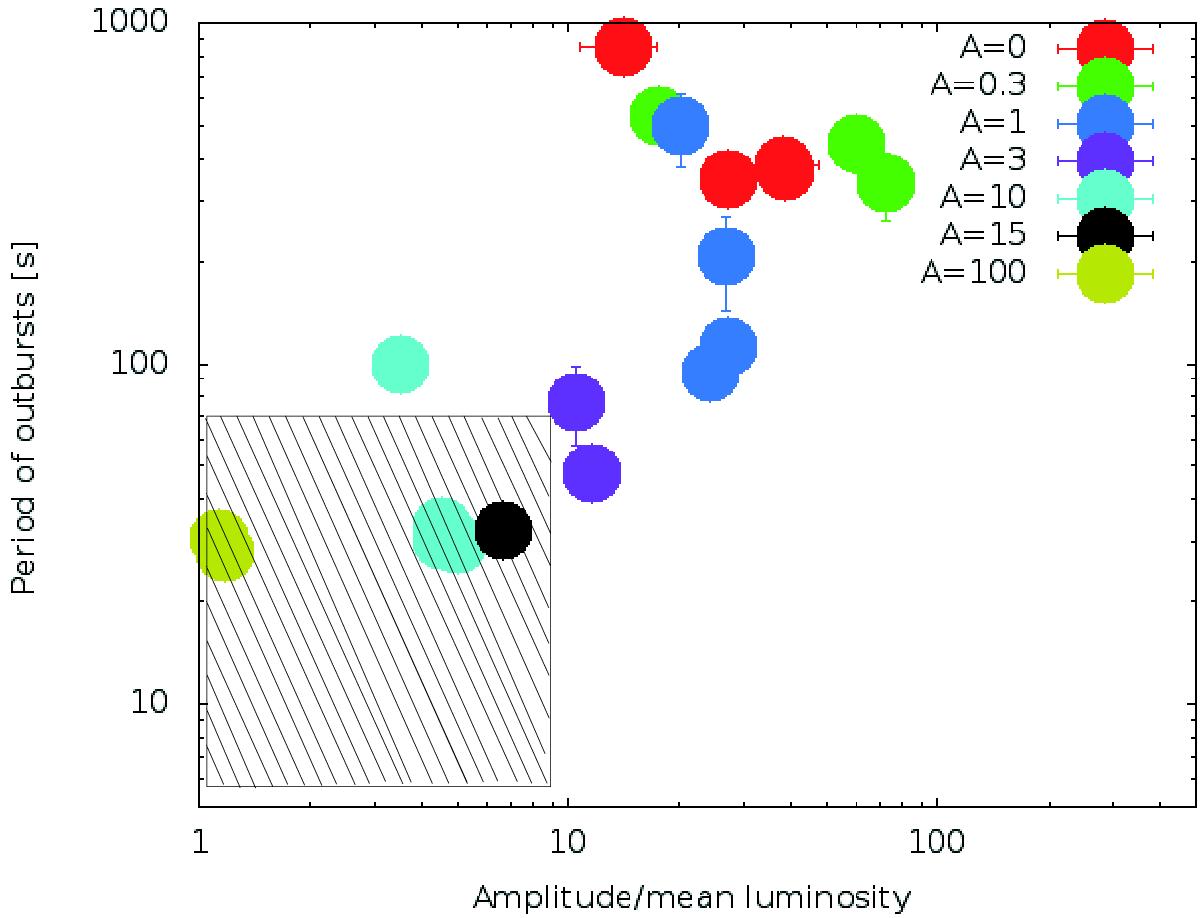
Dependence of the outburst amplitudes and periods on the wind strength A. Shaded regions mark observed amplitudes and timescales of the microquasar heartbeats. Different colors mark different values of the parameter, as indicated in the plot. Models were ran for ṁ between 0.04 and 0.1. In general, the lower the accretion rates, the shorter the outbursts, as long as the instability occurs.
Current usage metrics show cumulative count of Article Views (full-text article views including HTML views, PDF and ePub downloads, according to the available data) and Abstracts Views on Vision4Press platform.
Data correspond to usage on the plateform after 2015. The current usage metrics is available 48-96 hours after online publication and is updated daily on week days.
Initial download of the metrics may take a while.