Fig. 2
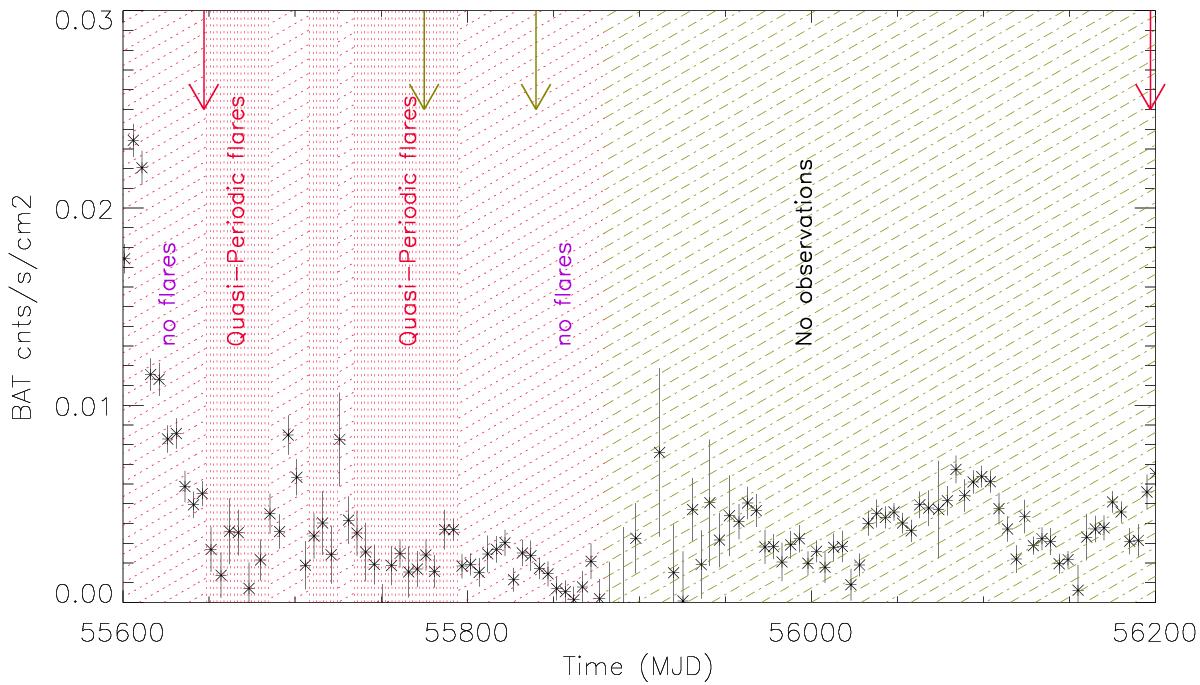
Swift/BAT 15–50 keV light curve superimposed on a time-line sketch created from the Swift/XRT, RXTE/PCA, Chandra, and XMM data analysis, showing the anticorrelation between the wind and heartbeat in IGR J17091 The second Chandra observation (second green arrow) shows a fast, ionized wind, while the first XMM-Newton observation (first red arrows) and the first Chandra observation (first green arrow) lie in the heartbeat zone and do not show any detectable wind outflow. During the last XMM-Newton observation (second red arrow), the source is in a hard state. The parts with no flare are marked with red-oblique-dashed lines. Finally the green-oblique-dashed lines individuate periods without observations.
Current usage metrics show cumulative count of Article Views (full-text article views including HTML views, PDF and ePub downloads, according to the available data) and Abstracts Views on Vision4Press platform.
Data correspond to usage on the plateform after 2015. The current usage metrics is available 48-96 hours after online publication and is updated daily on week days.
Initial download of the metrics may take a while.