Fig. 1
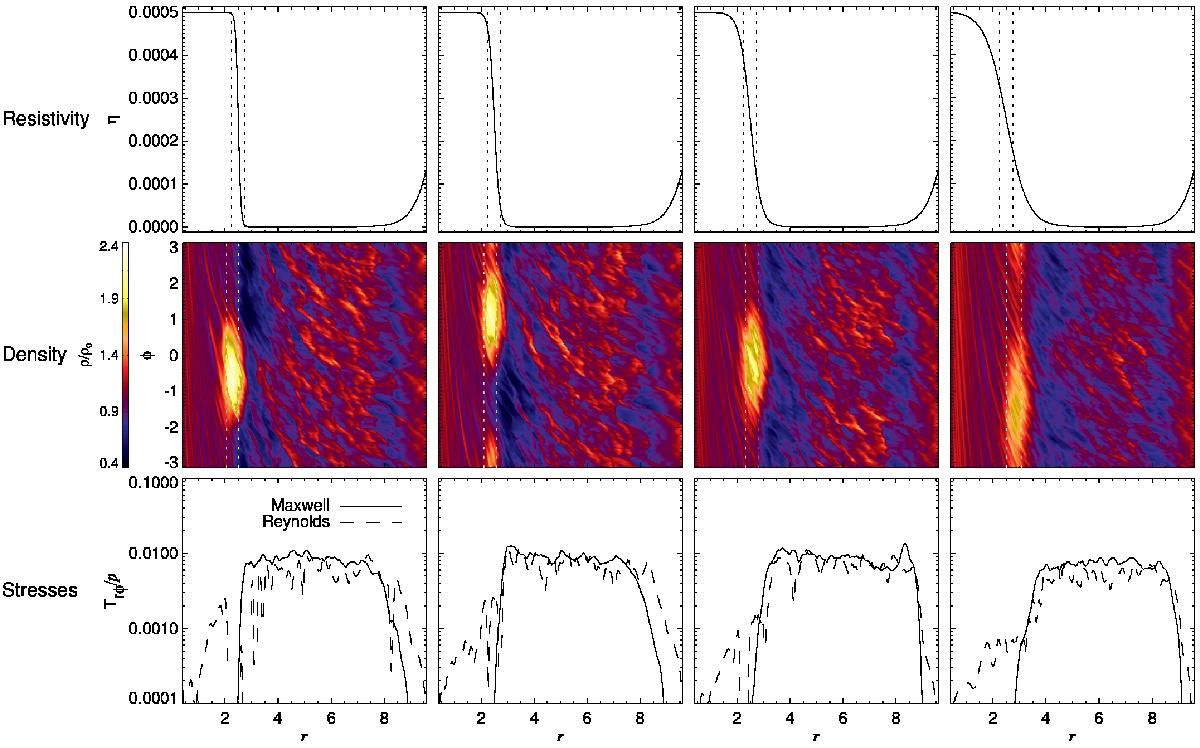
Suite of MHD simulations. From left to right, the transition width is h1 = 0.1, 0.2, 0.4 and 0.8. The resulting resistivity profiles are shown in the upper panels. The dashed vertical lines correspond to 2H around the jump center at r = 2.5. The model with h1 = 0.8 corresponds to a smooth jump from r ≈ 1 to r ≈ 4, i.e., over ≈15 scale heights. Although at different times, all models develop a sharp density bump that goes unstable to the RWI, producing a Rossby vortex (middle panels). The panels, from left to right, correspond to density snapshots at 100, 100, 122, and 232T0, where T0 is the orbital period at r = 1. The dashed vertical lines correspond to 2H around the density maximum. The reason for RWI excitation in these cases is because even though the resistivity jump is smooth, the transition in Maxwell stress remains sharp (lower panels). The transition in Reynolds stress is somewhat smoother, but turbulent stresses do not blur gradients in the same way Laplacian viscosity does, and the density bump remains RWI-unstable.
Current usage metrics show cumulative count of Article Views (full-text article views including HTML views, PDF and ePub downloads, according to the available data) and Abstracts Views on Vision4Press platform.
Data correspond to usage on the plateform after 2015. The current usage metrics is available 48-96 hours after online publication and is updated daily on week days.
Initial download of the metrics may take a while.