Fig. 1
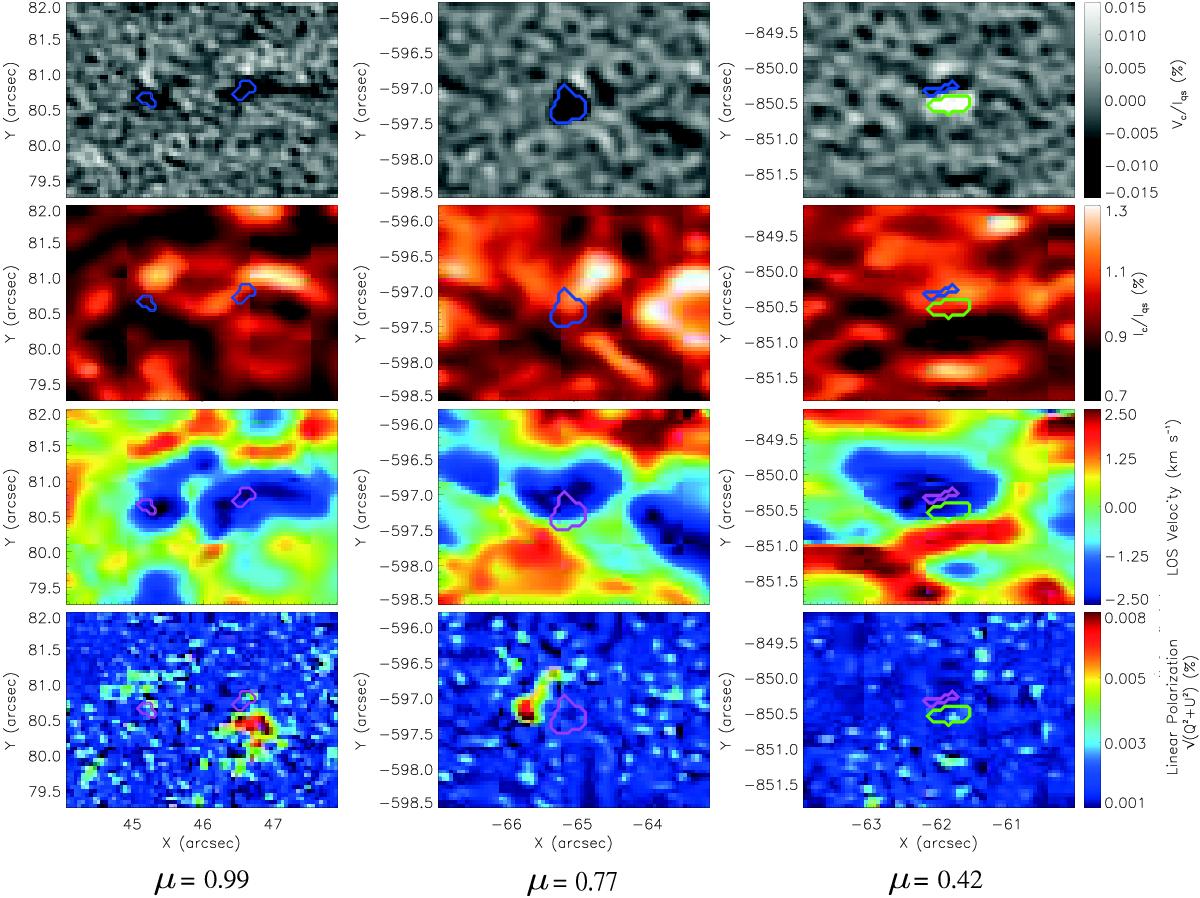
Examples of jets detected in Stokes Vc images at μ = 0.99 (leftmost panels), μ = 0.76 (middle row of panels) and μ = 0.42 (rightmost panels). From top to bottom the panels depict the continuum circular polarization normalized to the averaged quiet-Sun continuum intensity (Vc/Iqs), the continuum intensity normalized to the quiet-Sun average (Ic/Iqs), the LOS velocity, and the linear polarization averaged spectrally over the Fe i 5250.2 Å line. The contours outline | Vc | > | 1.25× 10⁻² | Ic, where the blue contours (red in the lower two rows) signify negative values and the green contours positive values.
Current usage metrics show cumulative count of Article Views (full-text article views including HTML views, PDF and ePub downloads, according to the available data) and Abstracts Views on Vision4Press platform.
Data correspond to usage on the plateform after 2015. The current usage metrics is available 48-96 hours after online publication and is updated daily on week days.
Initial download of the metrics may take a while.