Free Access
Fig. 3
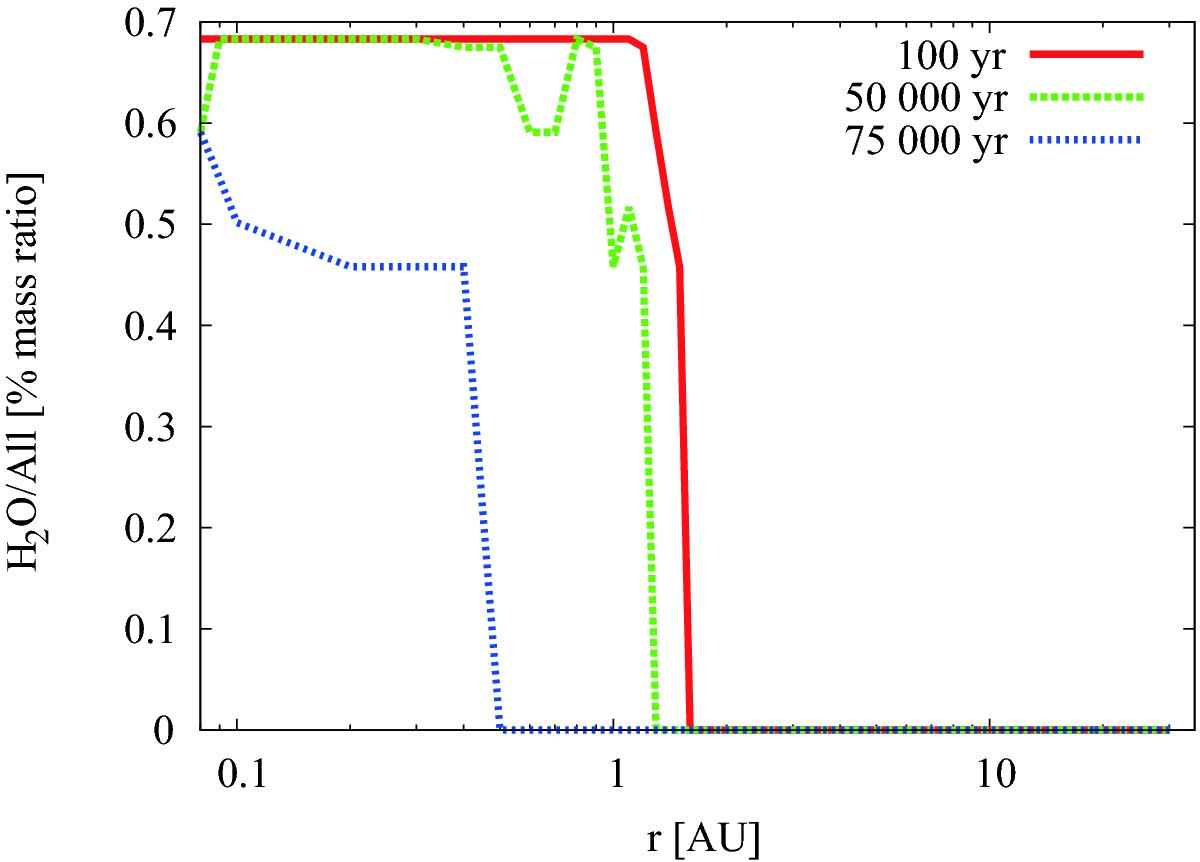
Time evolution of the gas phase abundance of H2O relative to all gas for disc #1 (Σ0 = 95.8 g cm-2, acore = 46 AU, γ = 0.9). The plot is shown for CO/H2O = 0.2 and without irradiation. Note that the 100 000 yr curve is set to zero since H2O has disappeared from the disc by this time.
Current usage metrics show cumulative count of Article Views (full-text article views including HTML views, PDF and ePub downloads, according to the available data) and Abstracts Views on Vision4Press platform.
Data correspond to usage on the plateform after 2015. The current usage metrics is available 48-96 hours after online publication and is updated daily on week days.
Initial download of the metrics may take a while.