Fig. 2
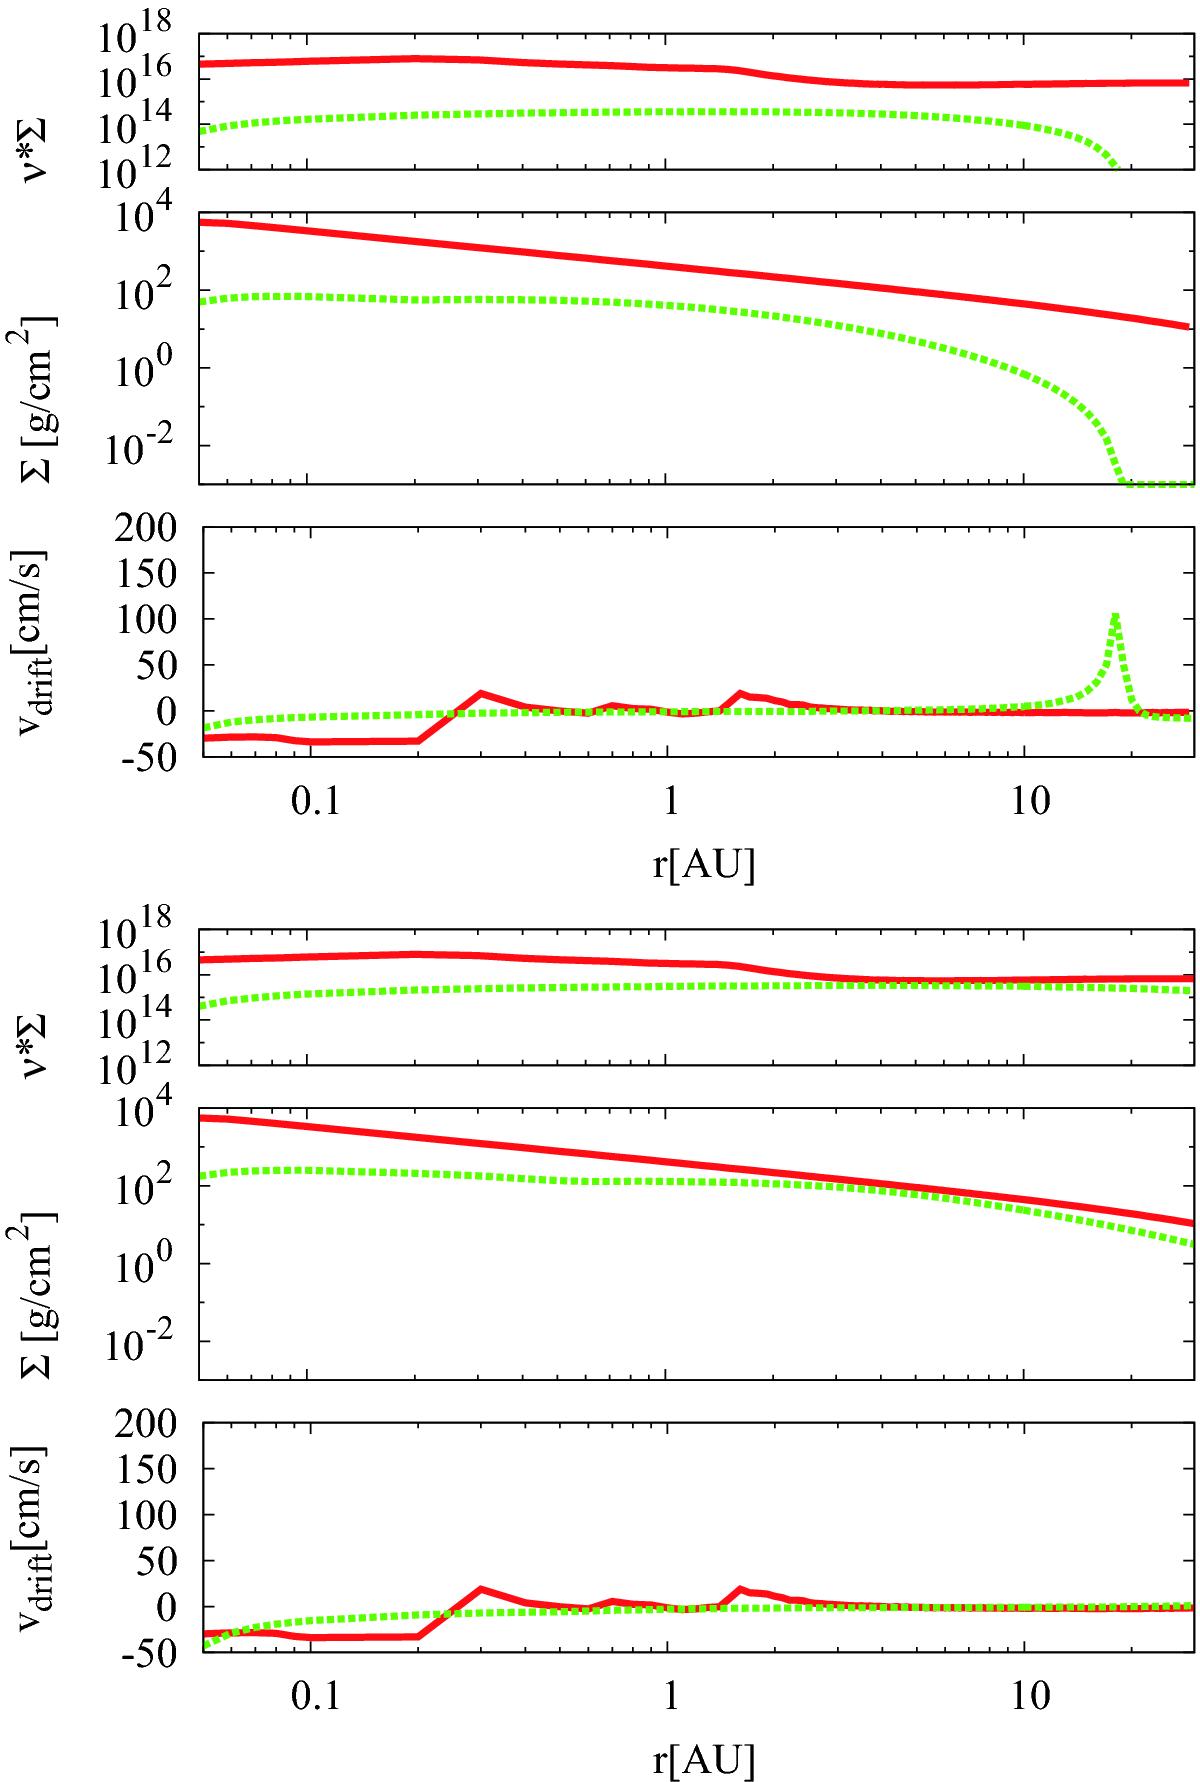
Radial profiles of the drift velocity of the gas, the surface density Σ of the gas, and νΣ for the model without irradiation (top) and with irradiation (bottom). The plots are shown for disc #1 (Σ0 = 95.8 g cm-2, acore = 46 AU, γ = 0.9) at the beginning (red line) and the end (green line) of the simulations (t = 10 Myr). The peak of vdrift at ~20 AU for the model without irradiation arises because Σ has reached its lowest value.
Current usage metrics show cumulative count of Article Views (full-text article views including HTML views, PDF and ePub downloads, according to the available data) and Abstracts Views on Vision4Press platform.
Data correspond to usage on the plateform after 2015. The current usage metrics is available 48-96 hours after online publication and is updated daily on week days.
Initial download of the metrics may take a while.