Free Access
Fig. 13
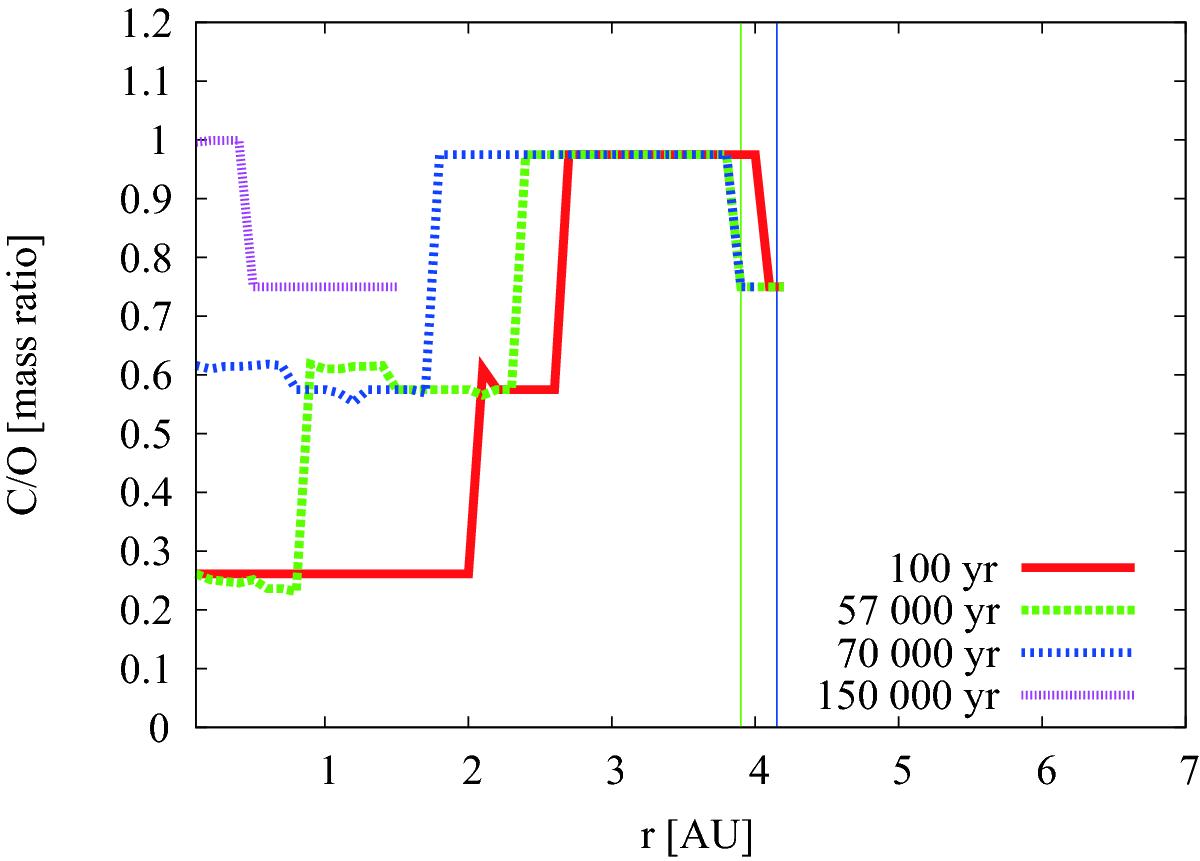
C/O mass ratio in the gas disc of the system in which planets A and B formed for different times (100, 57 000, 70 000 and 150 000 yr). The vertical lines show the starting position of planets A (blue) and B (green). The plot is shown for a model with CO/H2O = 0.2, without irradiation of the disc.
Current usage metrics show cumulative count of Article Views (full-text article views including HTML views, PDF and ePub downloads, according to the available data) and Abstracts Views on Vision4Press platform.
Data correspond to usage on the plateform after 2015. The current usage metrics is available 48-96 hours after online publication and is updated daily on week days.
Initial download of the metrics may take a while.