Fig. 9
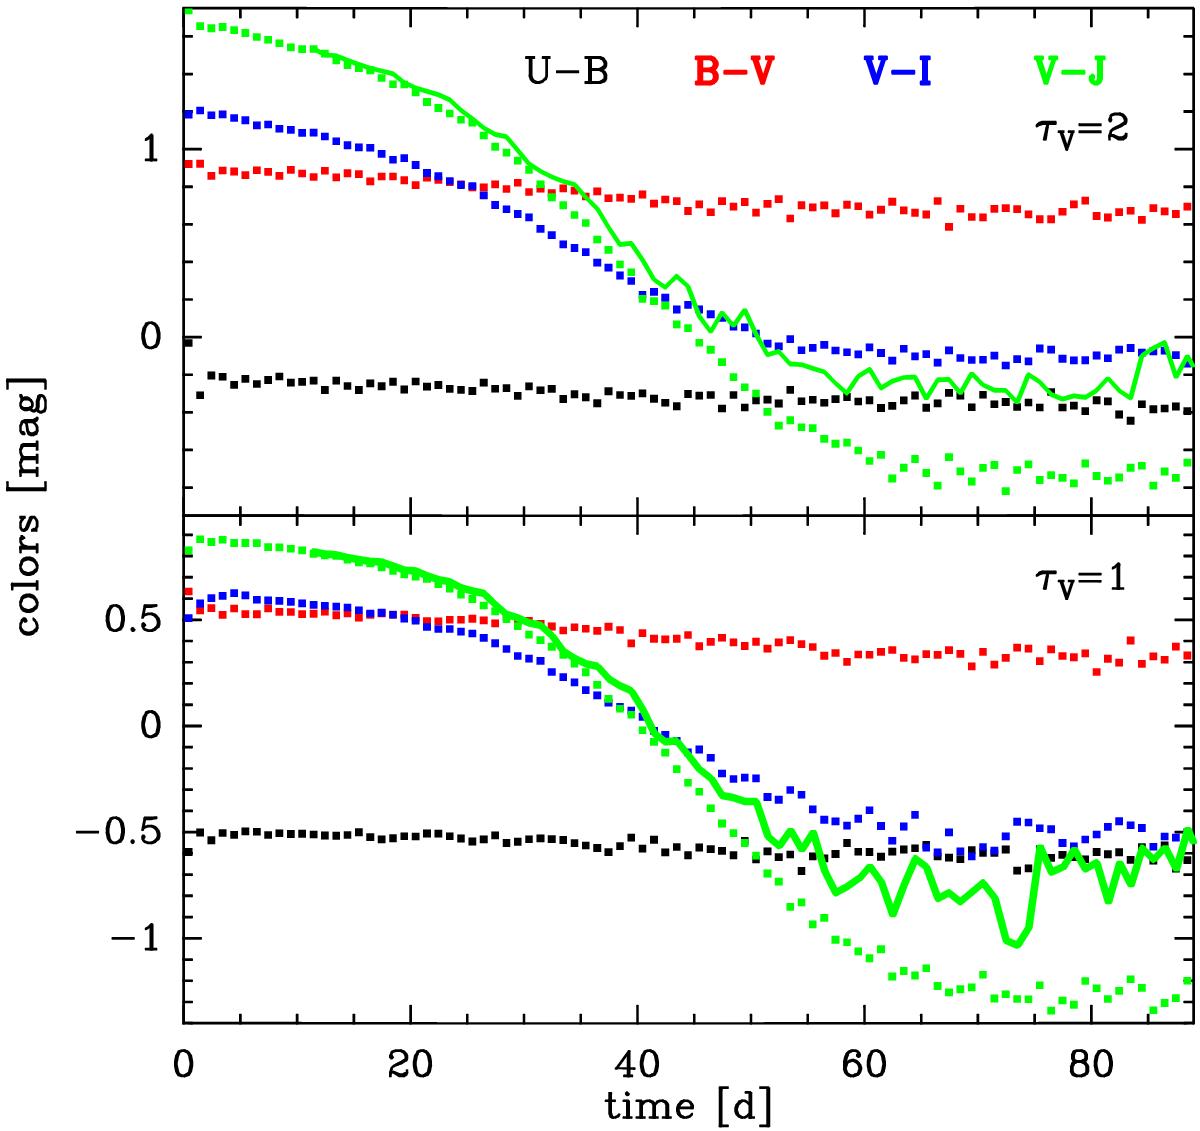
SN Model 1. Selected colors of the cloud. The (green) V − J curves split after ~30 days. The upper branches, which have the larger scatter, give the true model results, in the lower ones, the dust radiation at J has been subtracted. They would apply if the luminosity or the dust evaporation temperature were lower. But the latter would also imply a smaller inner shell radius R1 (see Fig. 2) if we stick to R1 = Rev.
Current usage metrics show cumulative count of Article Views (full-text article views including HTML views, PDF and ePub downloads, according to the available data) and Abstracts Views on Vision4Press platform.
Data correspond to usage on the plateform after 2015. The current usage metrics is available 48-96 hours after online publication and is updated daily on week days.
Initial download of the metrics may take a while.