Fig. 6
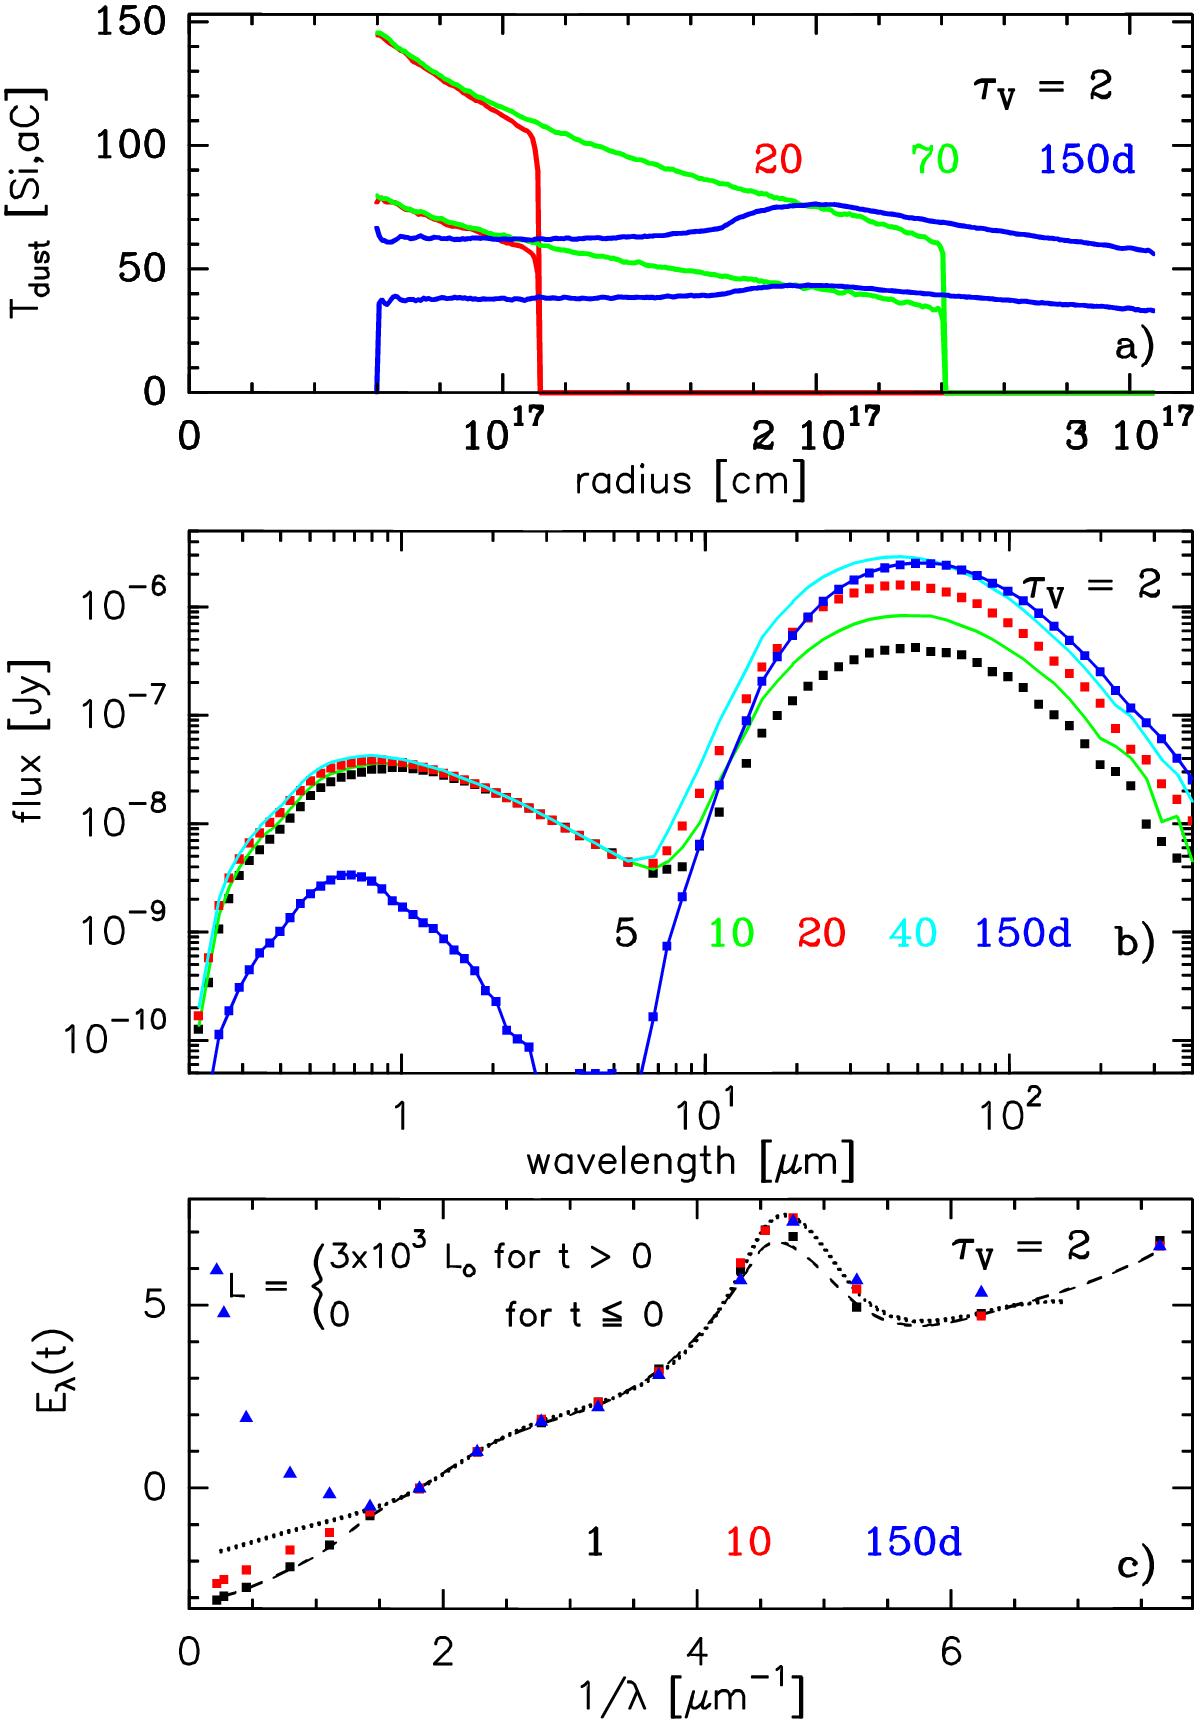
Model B, τV = 2. a) Dust temperatures in the cloud 20, 70 and 150 days after the first photons enter the envelope. Upper lines: amorphous carbon, lower lines: silicate grains. b) The SED 5, 10, 20, 100 and 150 days after the cloud becomes visible. c) The extinction curve 1, 20, 80 and 150 days after the cloud becomes visible. Dots mark the effective, dashes the standard extinction curve.
Current usage metrics show cumulative count of Article Views (full-text article views including HTML views, PDF and ePub downloads, according to the available data) and Abstracts Views on Vision4Press platform.
Data correspond to usage on the plateform after 2015. The current usage metrics is available 48-96 hours after online publication and is updated daily on week days.
Initial download of the metrics may take a while.