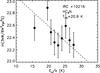
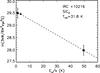
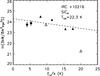
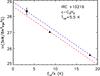
Fig. A.2
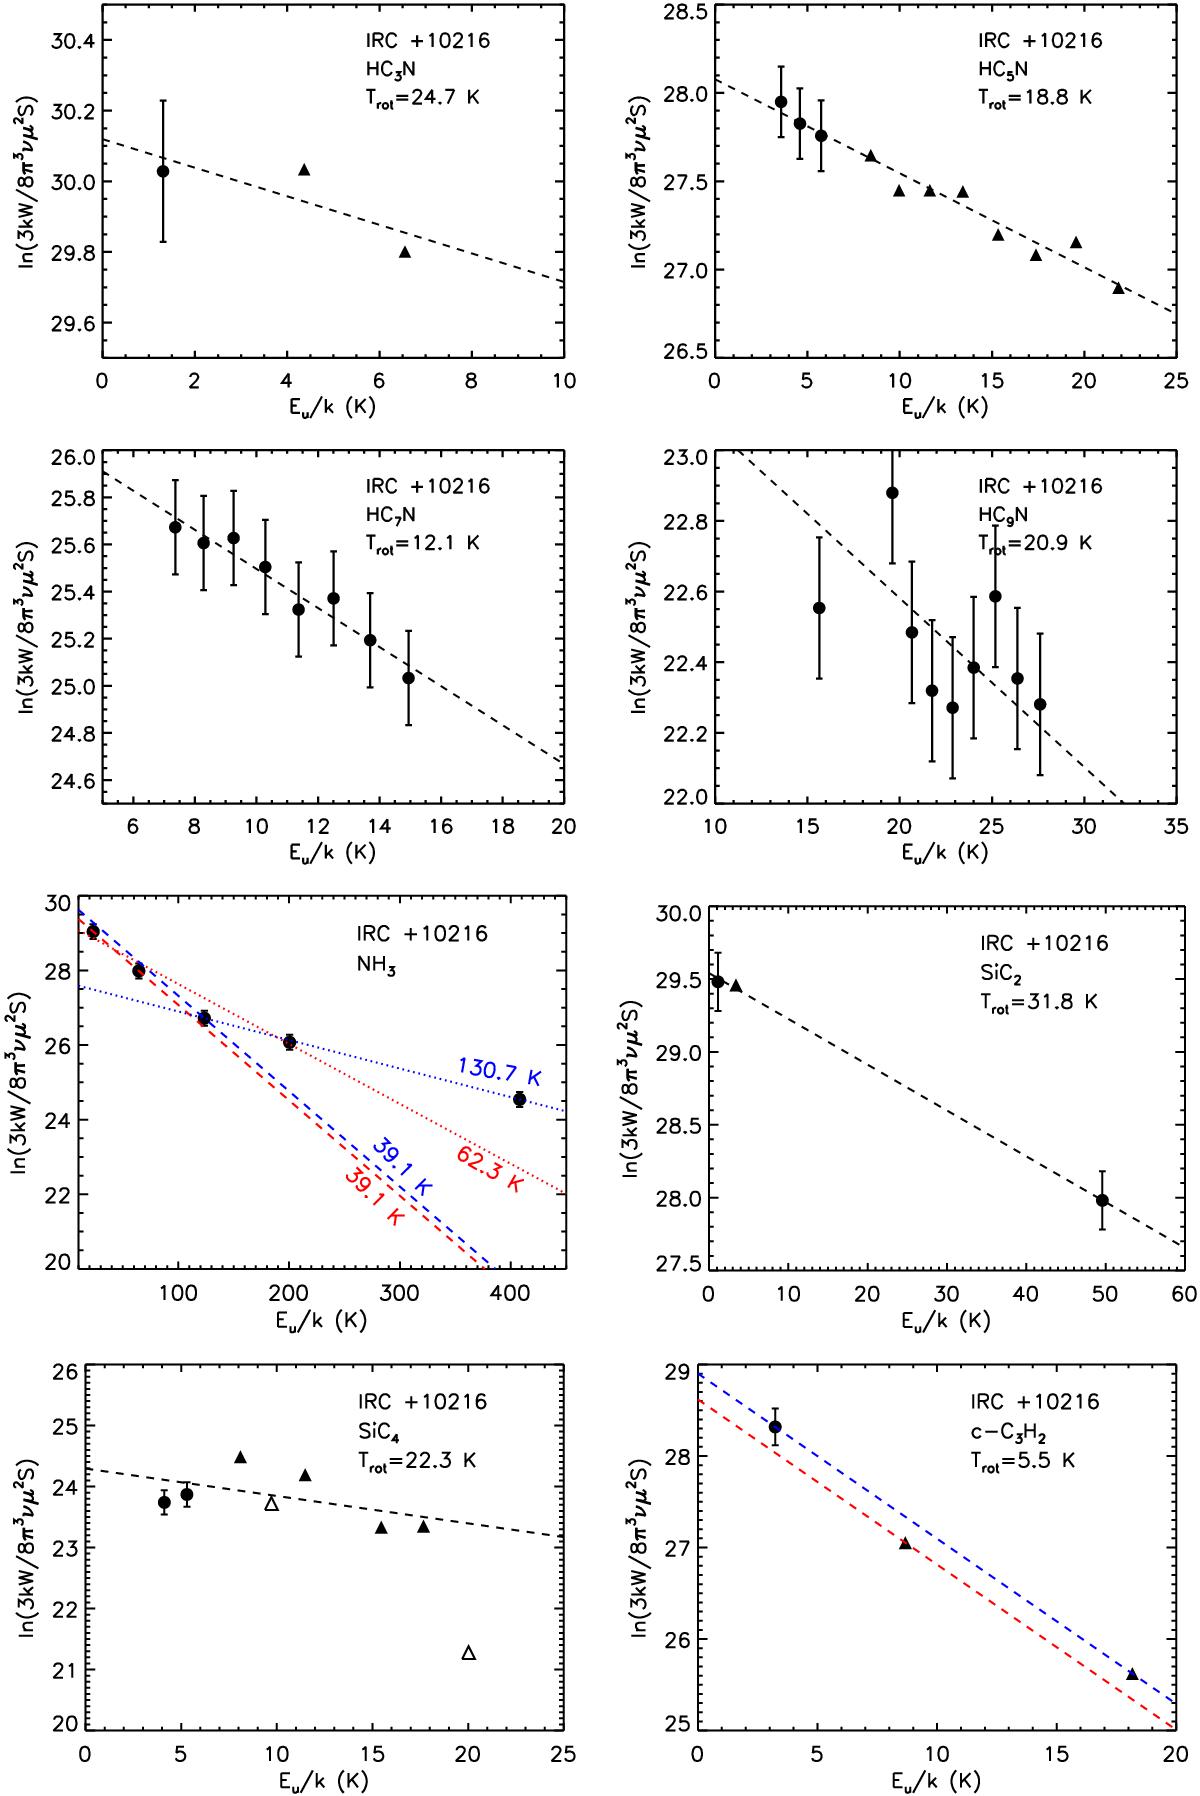
Rotational diagrams for the observed molecules in IRC +10216. For lines with hfs,
all observed components have been taken into account. The circles with error bars
are from our Effelsberg-100 m observations, where in addition to uncertainties in
the fit to the integrated line intensities, a calibration error of 20% has also
been included. Filled and open symbols indicate signal-to-noise ratios that are
larger than or less than five, respectively. The triangles without error bars are
obtained from Kawaguchi et al. (1995). The
pentagrams with error bars for C8H are obtained from Remijan et al. (2007), and the squares for C3N are from He et al. (2008). Their values have been
corrected for beam dilution. The molecules and their corresponding rotational
temperatures, obtained from unweighted linear fits, are given in the upper right
corner of each panel. Black dashed lines represent linear least-squares fit to the
rotational diagram accounting for data presented by filled symbols, and the black
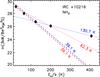
dot-dashed lines represent the fit when the open circles are included. The red and
blue dashed lines represent fits for the para and ortho states of
NH3 and
c-C3H2 and the ![]() and
and
![]() state of l-C5H and C6H, respectively.
Specifically for NH3, the red dashed line shows the fit to the
(J,K) = (1, 1) and (2, 2) para-lines, the blue
dashed line uses the resulting excitation temperature (39.1 K) and the
ortho-(3, 3) line, the dotted red line represents a fit to the para-(1, 1),
(2, 2), and (4, 4) transitions and the blue dotted line fits the ortho-(3, 3) and
(6, 6) transitions.
state of l-C5H and C6H, respectively.
Specifically for NH3, the red dashed line shows the fit to the
(J,K) = (1, 1) and (2, 2) para-lines, the blue
dashed line uses the resulting excitation temperature (39.1 K) and the
ortho-(3, 3) line, the dotted red line represents a fit to the para-(1, 1),
(2, 2), and (4, 4) transitions and the blue dotted line fits the ortho-(3, 3) and
(6, 6) transitions.
Current usage metrics show cumulative count of Article Views (full-text article views including HTML views, PDF and ePub downloads, according to the available data) and Abstracts Views on Vision4Press platform.
Data correspond to usage on the plateform after 2015. The current usage metrics is available 48-96 hours after online publication and is updated daily on week days.
Initial download of the metrics may take a while.