Fig. 5
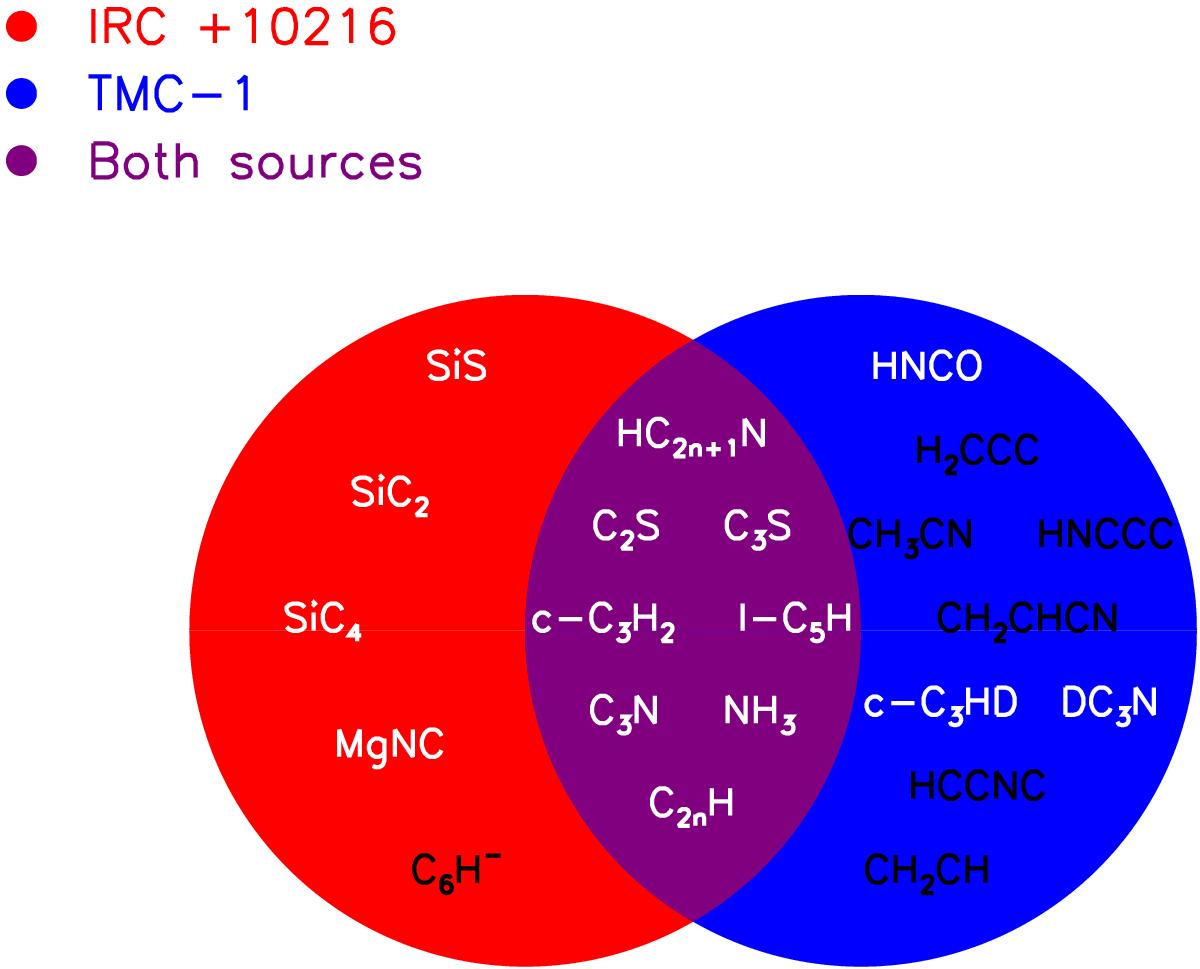
Schematic diagram of detected molecules in the same λ ~ 1.3 cm spectral range toward IRC +10216 and TMC-1. Molecules in the red, blue, and purple regions indicate that they are detected in IRC +10216, TMC-1, and both sources, respectively. The molecules in black indicate that they have been seen in both sources but are not detected toward the other source in the λ ~ 1.3 cm spectral range (see Sect. 4.5).
Current usage metrics show cumulative count of Article Views (full-text article views including HTML views, PDF and ePub downloads, according to the available data) and Abstracts Views on Vision4Press platform.
Data correspond to usage on the plateform after 2015. The current usage metrics is available 48-96 hours after online publication and is updated daily on week days.
Initial download of the metrics may take a while.