Fig. 4
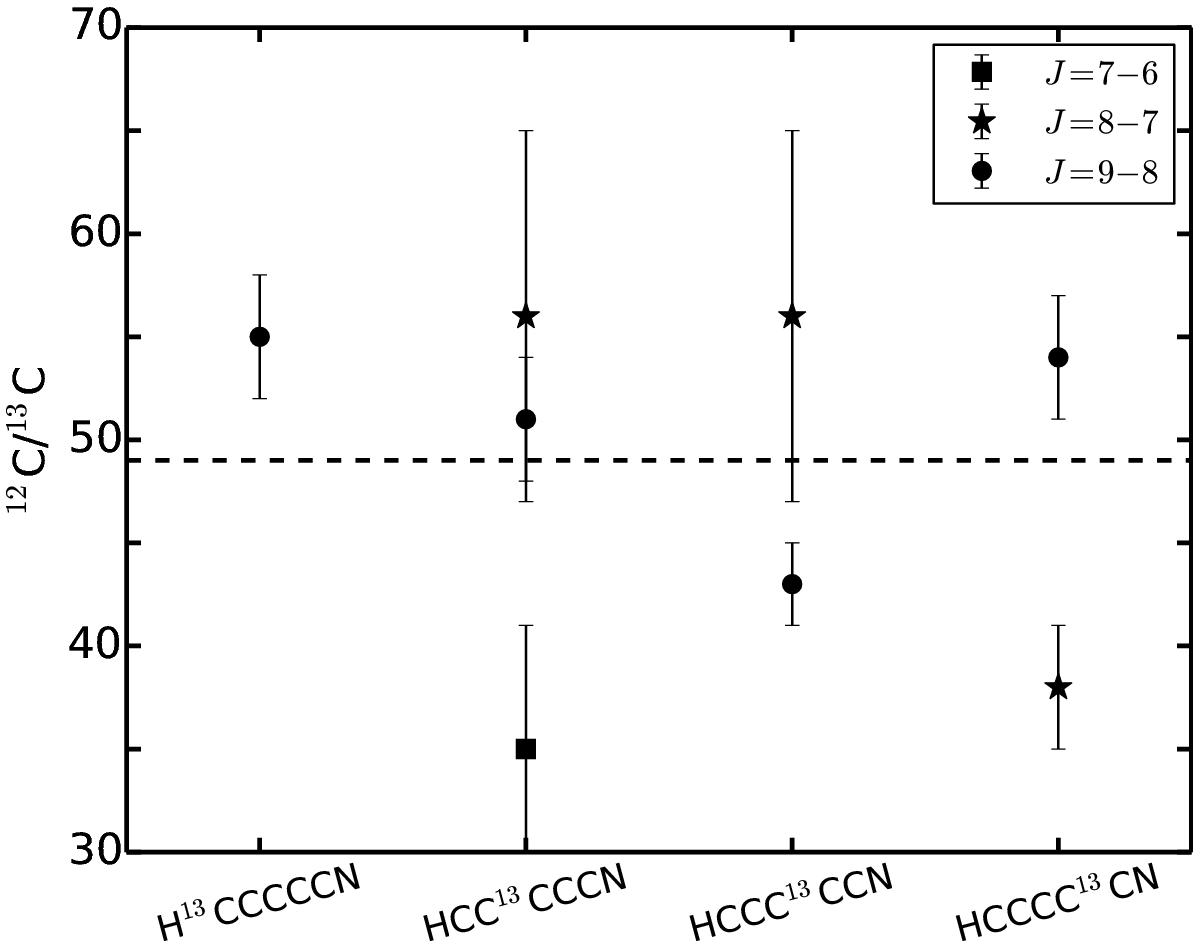
12C/13C isotopic abundance ratios from HC5N. The ratios are based on the integrated intensity of the transitions of HC5N and its 13C isotopologues. The ratios derived from the J = 7−6, J = 8−7, and J = 9−8 transitions are denoted with filled squares, pentagrams, and circles, respectively. The dashed line denotes the unweighted average 12C/13C value.
Current usage metrics show cumulative count of Article Views (full-text article views including HTML views, PDF and ePub downloads, according to the available data) and Abstracts Views on Vision4Press platform.
Data correspond to usage on the plateform after 2015. The current usage metrics is available 48-96 hours after online publication and is updated daily on week days.
Initial download of the metrics may take a while.