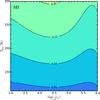
Fig. 3
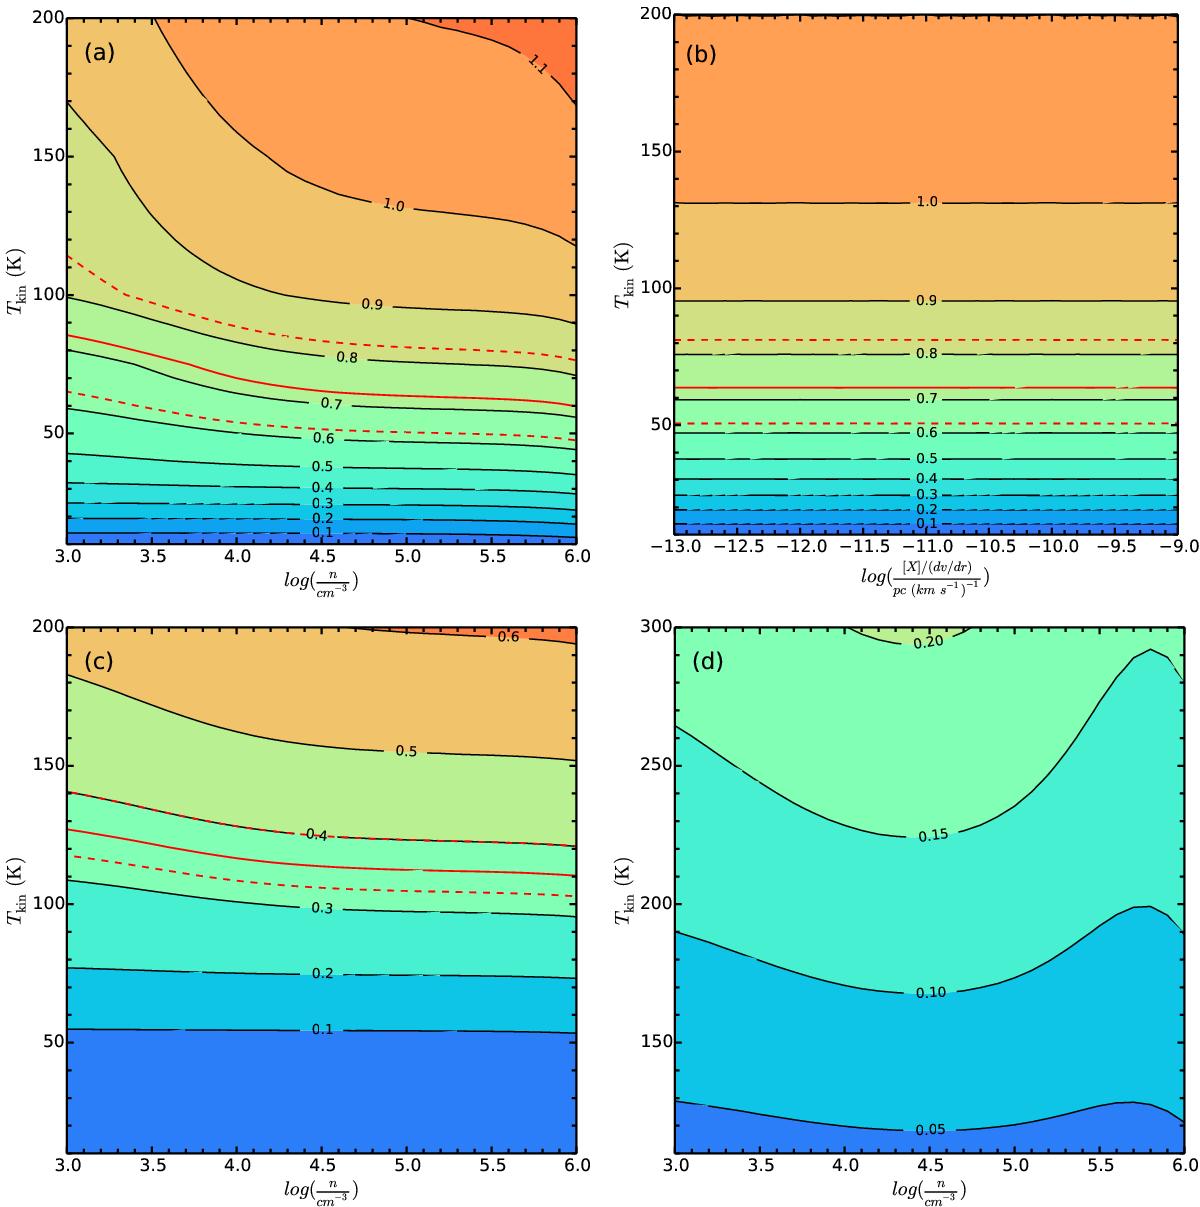
RADEX non-LTE modeling for NH3. a) the integrated intensity ratio
![]() as a function of nH2 and Tkin for a
given para-NH3 abundance per velocity gradient
[X]/(dv/dr) of 4.4 × 10⁻¹¹ pc
(km s-1)-1. b) the integrated intensity ratio
as a function of nH2 and Tkin for a
given para-NH3 abundance per velocity gradient
[X]/(dv/dr) of 4.4 × 10⁻¹¹ pc
(km s-1)-1. b) the integrated intensity ratio
![]() as a function of
[X]/(dv/dr) and Tkin for a
given density of 105 cm-3. In both panels, the levels go from 0.1 to 1 by
0.1. c) the integrated intensity ratio
as a function of
[X]/(dv/dr) and Tkin for a
given density of 105 cm-3. In both panels, the levels go from 0.1 to 1 by
0.1. c) the integrated intensity ratio
![]() as a function of nH2 and Tkin for a
given para-NH3 abundance per velocity gradient
[X]/(dv/dr) of 4.4 × 10⁻¹¹ pc
(km s-1)-1. The levels start from 0.1 to 0.6 by 0.1. The
red solid line and the dashed lines represent the observed line ratio as well as its
lower and upper limit in Figs. 3a–c. d)
the integrated intensity ratio
as a function of nH2 and Tkin for a
given para-NH3 abundance per velocity gradient
[X]/(dv/dr) of 4.4 × 10⁻¹¹ pc
(km s-1)-1. The levels start from 0.1 to 0.6 by 0.1. The
red solid line and the dashed lines represent the observed line ratio as well as its
lower and upper limit in Figs. 3a–c. d)
the integrated intensity ratio ![]() and as a function of nH2 and Tkin for a
given ortho-NH3 abundance per velocity gradient
[X]/(dv/dr) of 5.6 × 10⁻¹¹ pc
(km s-1)-1. The levels start from 0.05 to 0.2 by 0.05. The
observed line ratio
and as a function of nH2 and Tkin for a
given ortho-NH3 abundance per velocity gradient
[X]/(dv/dr) of 5.6 × 10⁻¹¹ pc
(km s-1)-1. The levels start from 0.05 to 0.2 by 0.05. The
observed line ratio ![]() = (0.28 ± 0.08) is beyond the modeled
range, indicating that the kinetic temperature is either higher than 300 K or that
NH3 (6, 6)
is affected by population inversion.
= (0.28 ± 0.08) is beyond the modeled
range, indicating that the kinetic temperature is either higher than 300 K or that
NH3 (6, 6)
is affected by population inversion.
Current usage metrics show cumulative count of Article Views (full-text article views including HTML views, PDF and ePub downloads, according to the available data) and Abstracts Views on Vision4Press platform.
Data correspond to usage on the plateform after 2015. The current usage metrics is available 48-96 hours after online publication and is updated daily on week days.
Initial download of the metrics may take a while.