Fig. 5
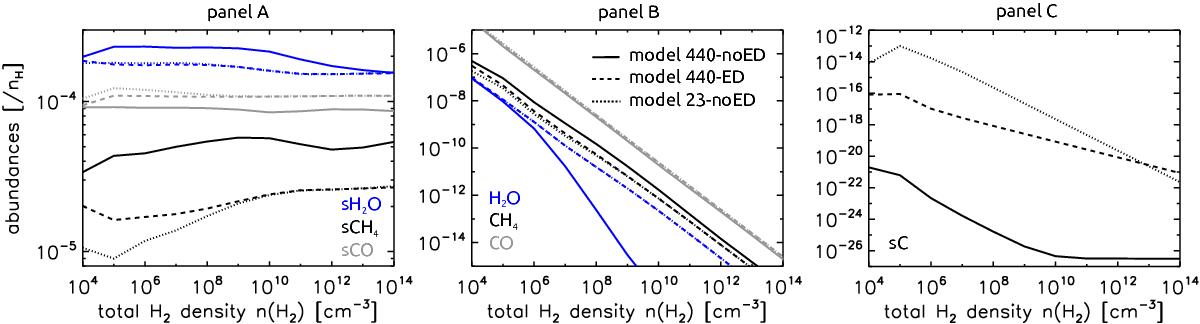
H2O (blue), CO (gray), and CH4 (black) abundances at 106 yr on a grain surface (panel A) and in the gas phase (panel B) plotted against total H2 density for the three models 440-noED (solid line), 23-noED (dotted line), and 440-ED (dashed line). Panel C contains the atomic carbon abundance on a grain surface at the same time and the same models.
Current usage metrics show cumulative count of Article Views (full-text article views including HTML views, PDF and ePub downloads, according to the available data) and Abstracts Views on Vision4Press platform.
Data correspond to usage on the plateform after 2015. The current usage metrics is available 48-96 hours after online publication and is updated daily on week days.
Initial download of the metrics may take a while.