Fig. 1
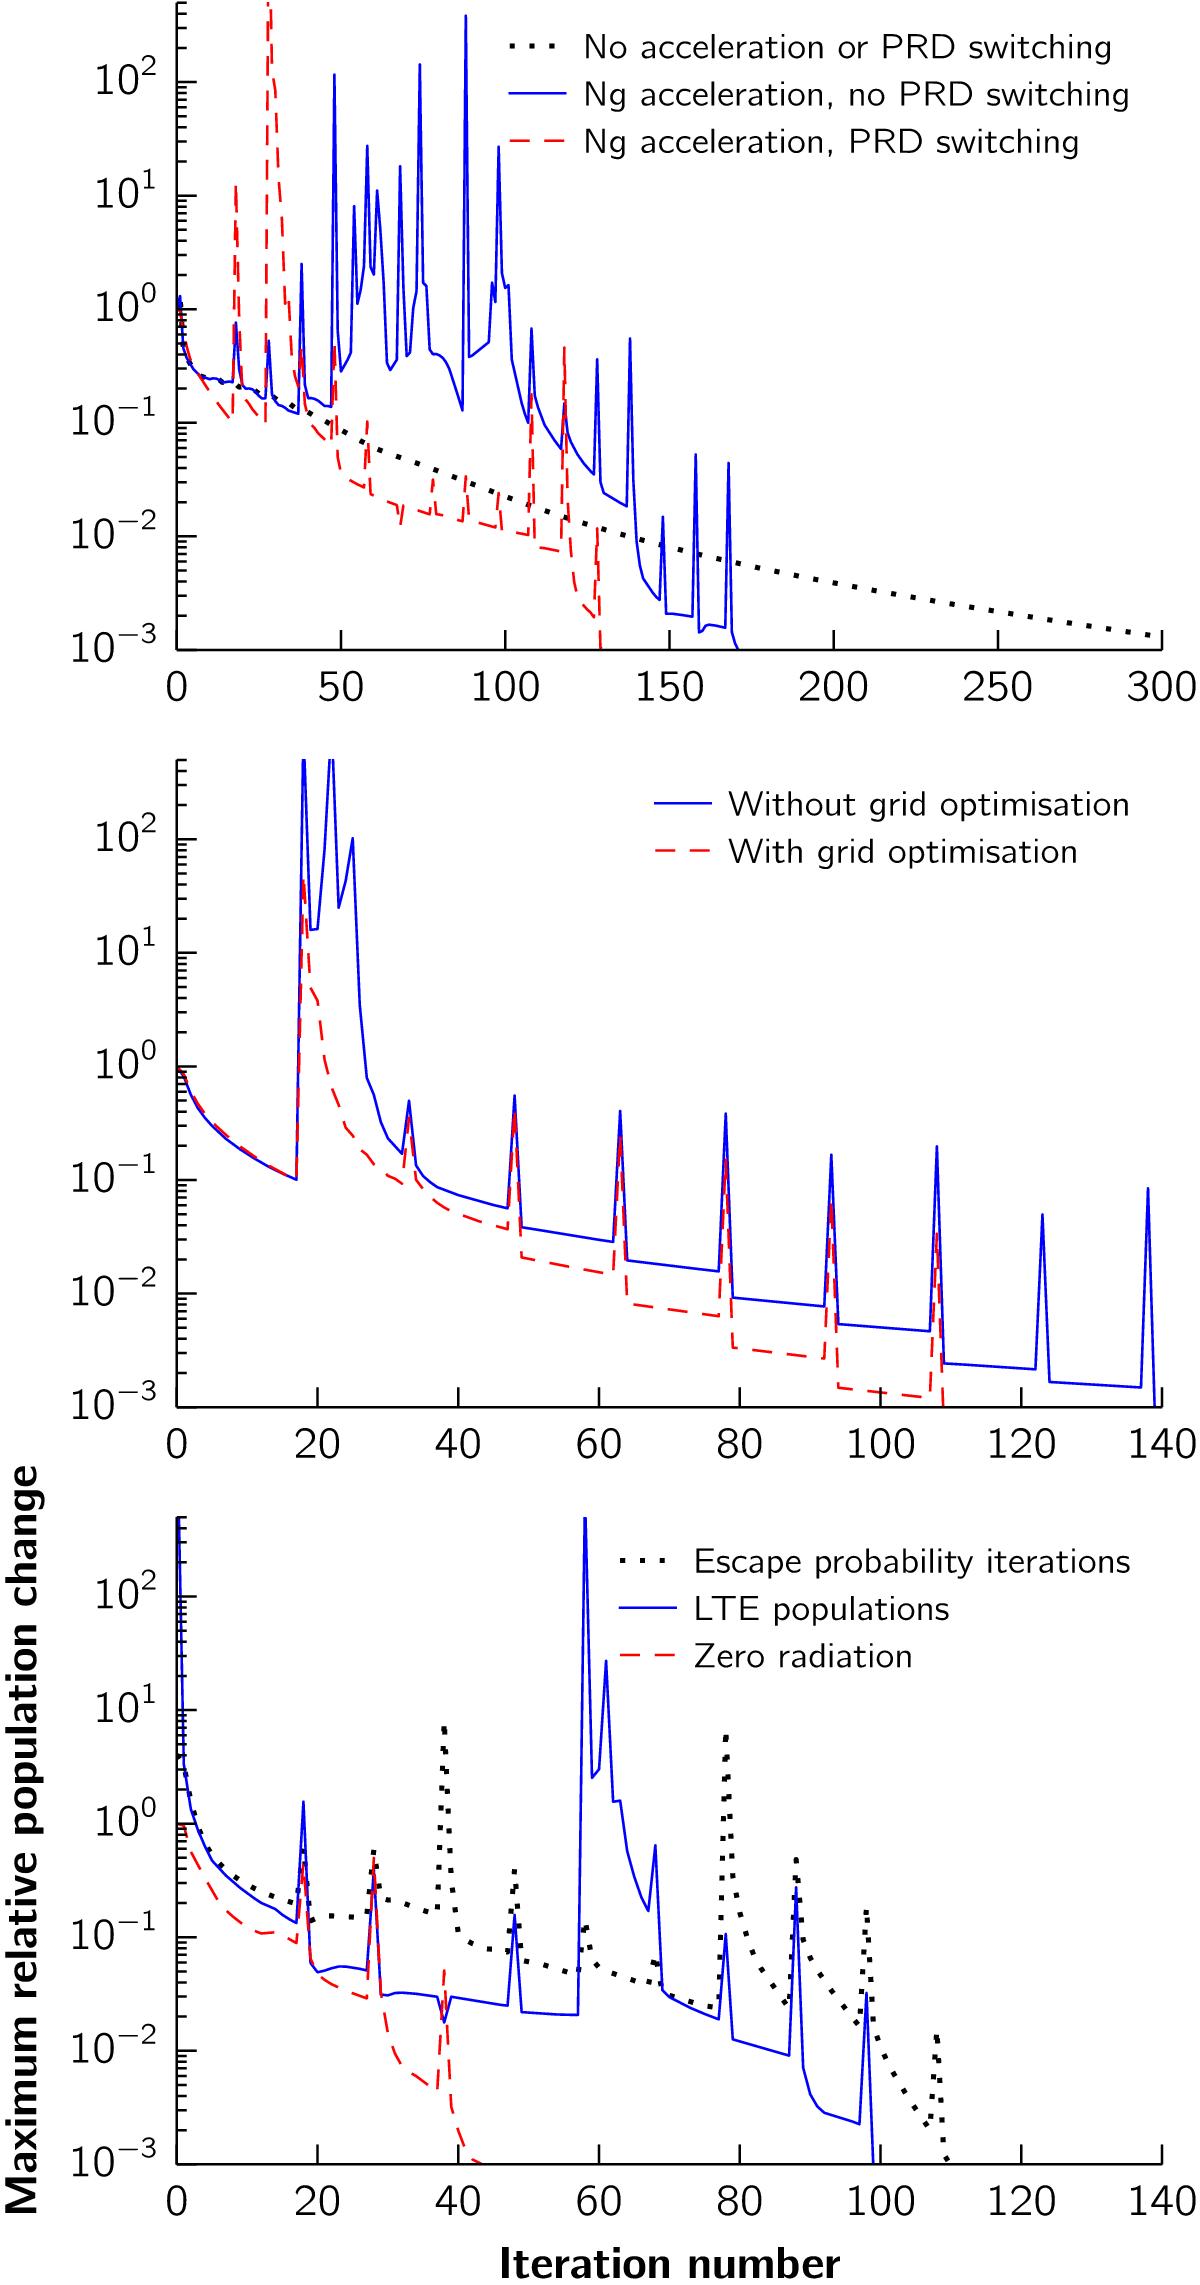
Effect of different optimisation options in the convergence behaviour. Each panel was calculated using a 5-level Mg ii atom with PRD in the h&k lines, for different columns of a 3D MHD simulation. Top panel: effect of Ng acceleration and PRD switching. Middle panel: effect of grid optimisation. Bottom panel: effect of different starting solutions.
Current usage metrics show cumulative count of Article Views (full-text article views including HTML views, PDF and ePub downloads, according to the available data) and Abstracts Views on Vision4Press platform.
Data correspond to usage on the plateform after 2015. The current usage metrics is available 48-96 hours after online publication and is updated daily on week days.
Initial download of the metrics may take a while.