Free Access
Fig. 4
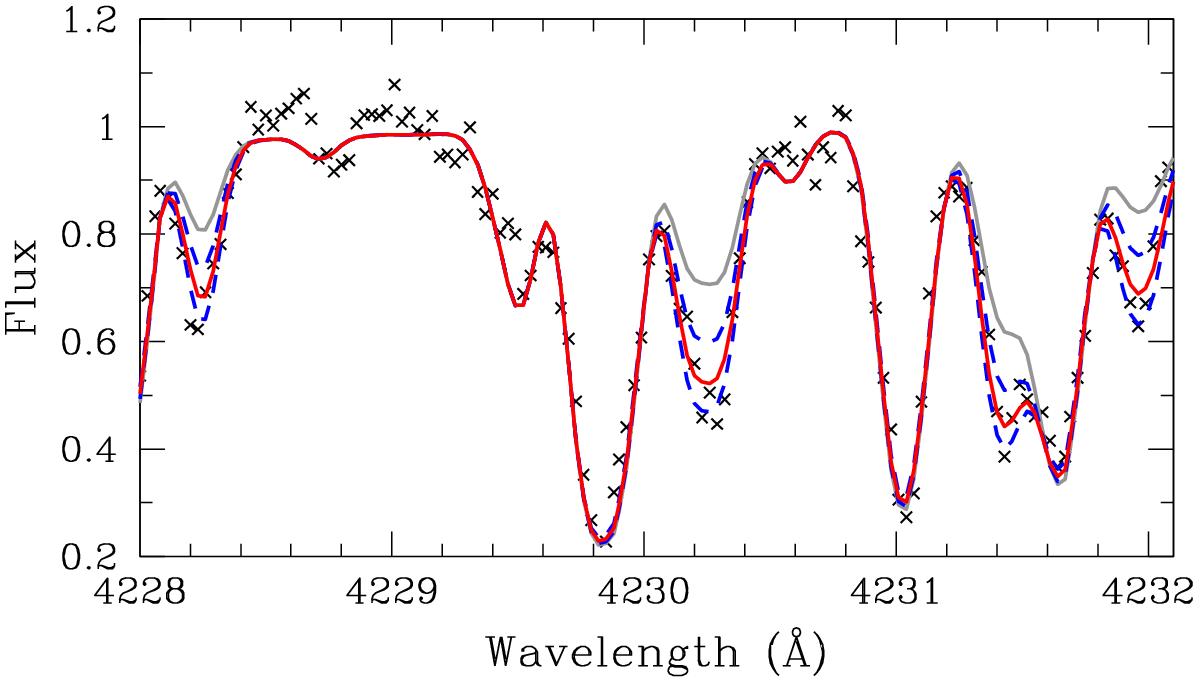
Example of the 13C features used for evaluating the 12C/13C isotope ratio. Solid gray line shows the synthetic spectrum assuming log 12C /13C = 1.3, value typical for unmixed giants (Spite et al. 2006), solid red line shows log 12C /13C = 0.8, and dashed blue lines show ratios ±0.2 from that value.
Current usage metrics show cumulative count of Article Views (full-text article views including HTML views, PDF and ePub downloads, according to the available data) and Abstracts Views on Vision4Press platform.
Data correspond to usage on the plateform after 2015. The current usage metrics is available 48-96 hours after online publication and is updated daily on week days.
Initial download of the metrics may take a while.