Fig. 2
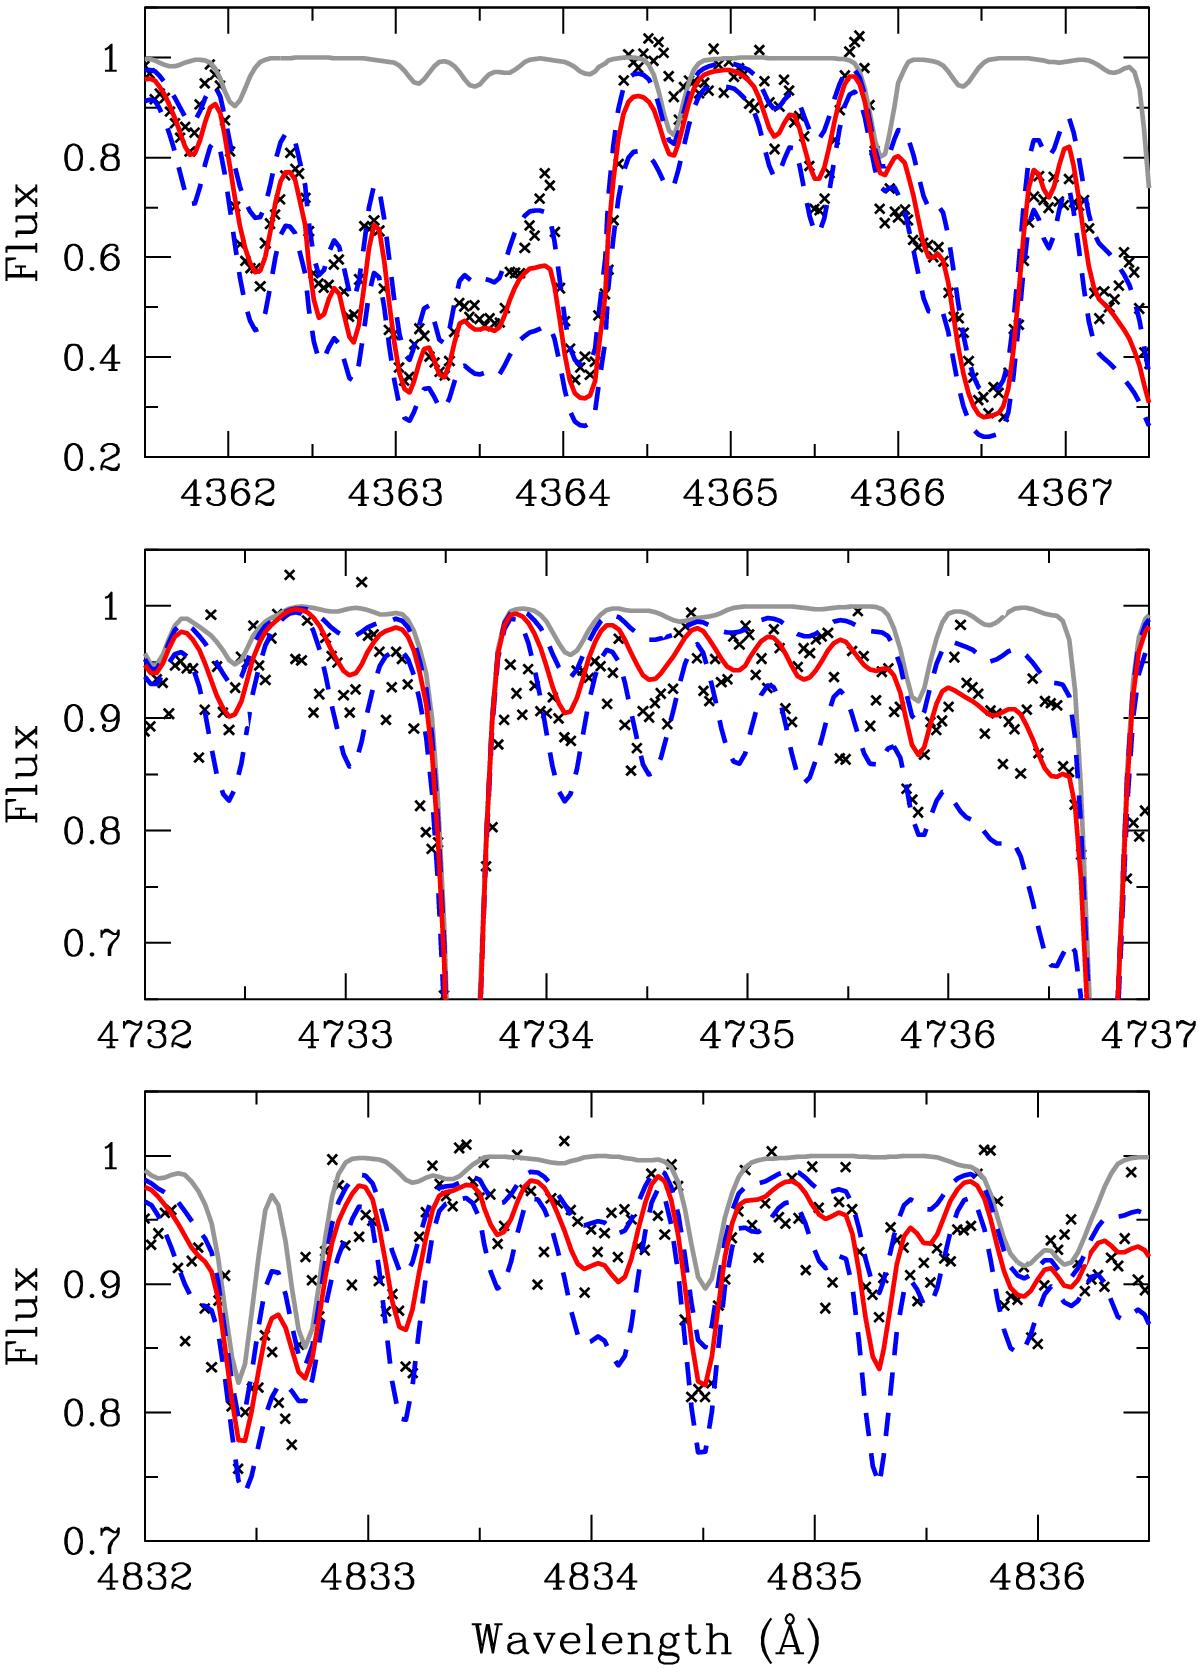
Spectra of different regions used for the measurement of carbon. Top panel shows part of the CH region at ~4300Å (G-band), middle panel shows the C2 band, and lowest panel shows the CH band (A-X system) at ~4850 Å. In all cases, solid red lines show best fits of the regions (as listed in the text), dashed blue lines show carbon values ±0.20 from that fit, and solid gray lines show how the spectrum would look without any carbon. Note that the scale on the y-axis is not the same for all panels.
Current usage metrics show cumulative count of Article Views (full-text article views including HTML views, PDF and ePub downloads, according to the available data) and Abstracts Views on Vision4Press platform.
Data correspond to usage on the plateform after 2015. The current usage metrics is available 48-96 hours after online publication and is updated daily on week days.
Initial download of the metrics may take a while.