Fig. 1
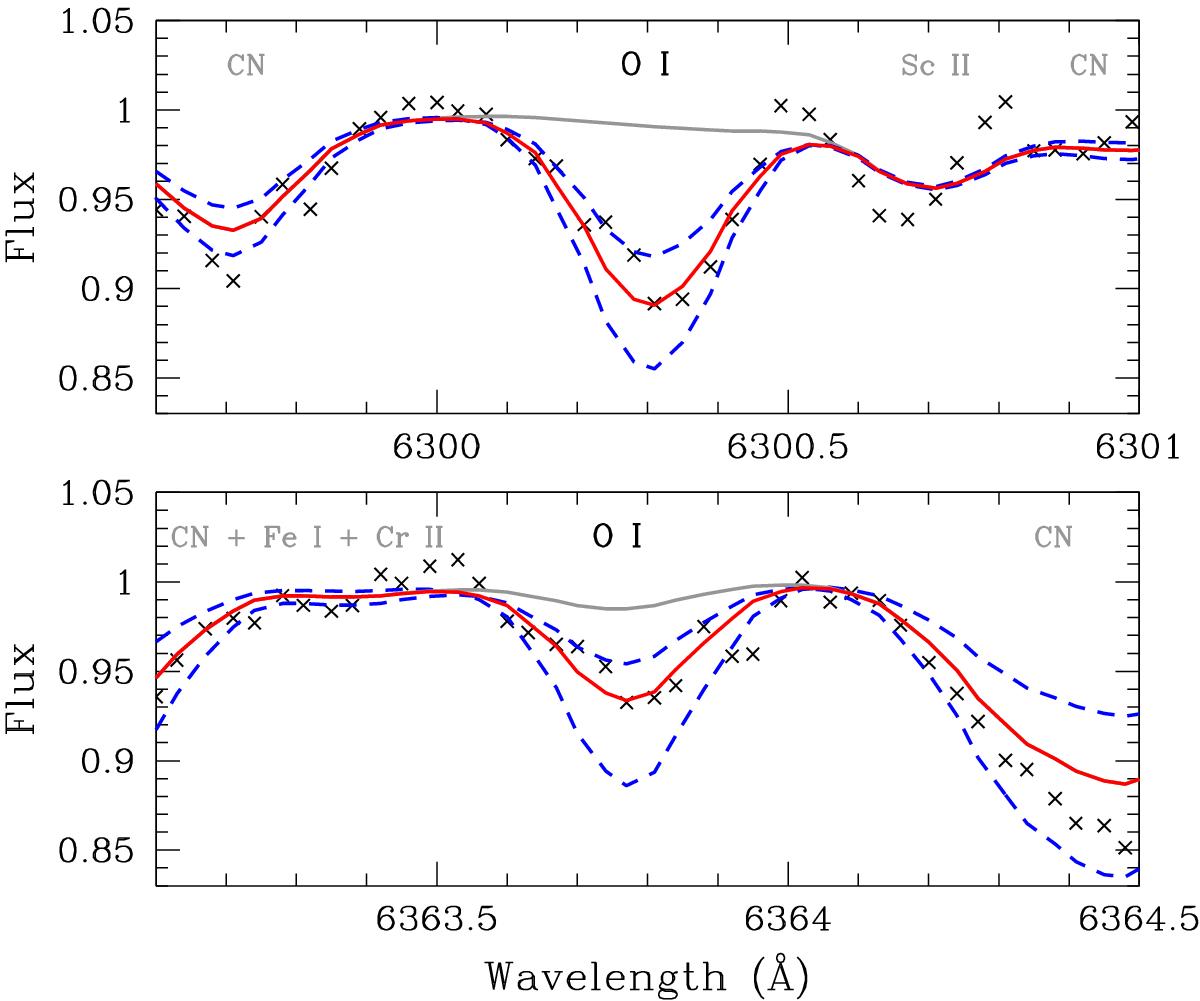
Measured oxygen lines, log ϵ(O)6300 Å = 7.30 ± 0.14 and log ϵ(O)6364 Å = 7.46 ± 0.30. Solid red lines show best fits, and dashed blue lines show upper and lower limits of error bars. Cases where [O I] lines have been removed from the linelist are shown with solid gray lines. The strength of CN molecular lines is very sensitive to oxygen abundance. Adopting a lower O abundance will make CN lines in the synthetic spectrum stronger, assuming fixed values of C and N.
Current usage metrics show cumulative count of Article Views (full-text article views including HTML views, PDF and ePub downloads, according to the available data) and Abstracts Views on Vision4Press platform.
Data correspond to usage on the plateform after 2015. The current usage metrics is available 48-96 hours after online publication and is updated daily on week days.
Initial download of the metrics may take a while.