Fig. 6
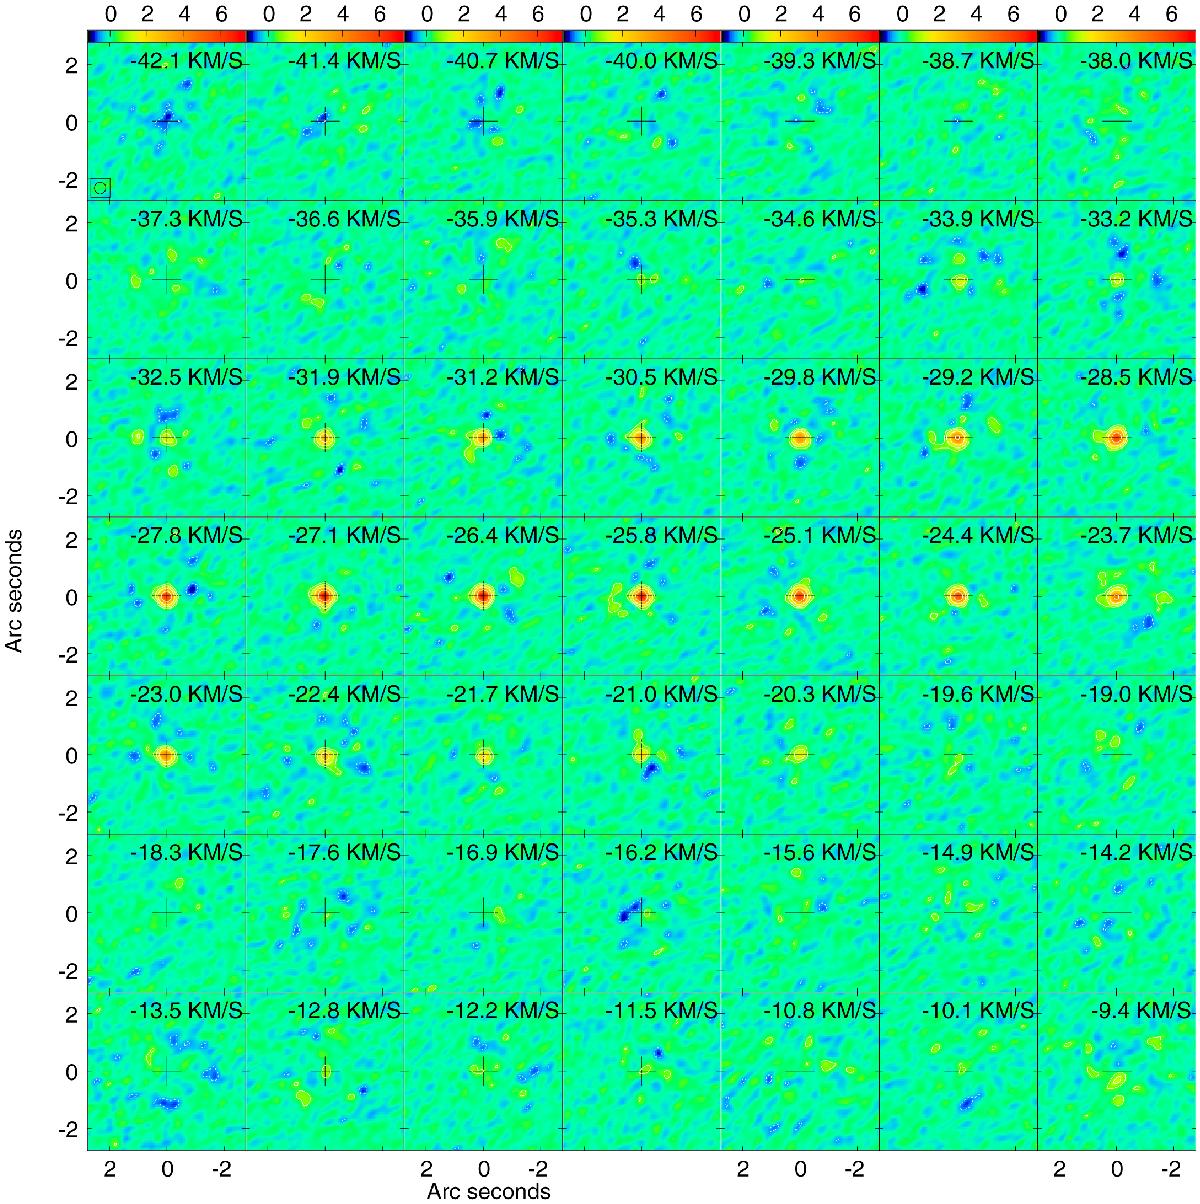
SiS v = 2J = 36–35 channel map, averaged over three channels with a natural weighting and for a circular beam of 0.4′′. North is up, east is left; the black cross indicates the centre of the continuum map. The flux density units are Jy/beam. The contours are at (−1, 1, 2, 4, 8...) × 0.5 Jy/beam (~3σrms). This high-excitation line has a width of ~9 km s-1, and the line formation region is unresolved with the current ALMA beam. The contrast in the figure is best visible on screen.
Current usage metrics show cumulative count of Article Views (full-text article views including HTML views, PDF and ePub downloads, according to the available data) and Abstracts Views on Vision4Press platform.
Data correspond to usage on the plateform after 2015. The current usage metrics is available 48-96 hours after online publication and is updated daily on week days.
Initial download of the metrics may take a while.