Fig. 5
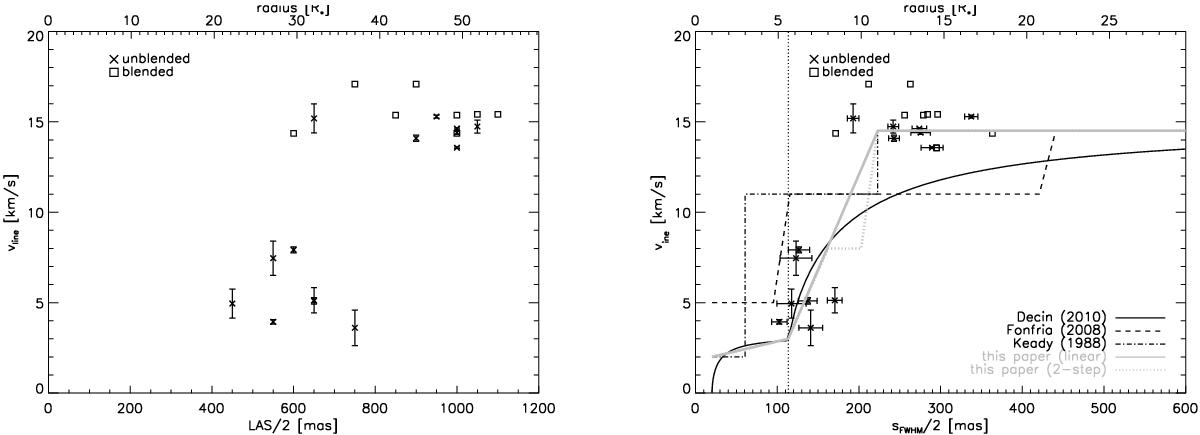
Measured wind velocities (as determined from the half-line width vline) versus half of the LAS (representing the not-deconvolved largest detectable scale of each transition) in the left panel and half of the spatial FWHM sFWHM (representing the dominant line formation region) in the right panel. Note that the value for the LAS is restricted by the sensitivity limit of the observations and the fact that large-scale flux might be resolved out (see Sect. 2.2). The blended lines are indicated with a squared box, the unblended lines with a cross (and include the error bars). In the right panel, the full black line shows the velocity structure as derived by Decin et al. (2010a) from solving the momentum equation; the dashed line indicates the velocity structure as derived by Fonfría et al. (2008) from modelling different J ro-vibrational transitions of C2H2, the dashed-dotted line the velocity structure derived by Keady et al. (1988) from the analysis of the near-infrared ro-vibrational CO spectrum, and the thick grey lines the acceleration derived from the ALMA data. The vertical dotted line indicates the dust nucleation region around 5.6 R⋆, where the sound velocity is ~3 km s-1.
Current usage metrics show cumulative count of Article Views (full-text article views including HTML views, PDF and ePub downloads, according to the available data) and Abstracts Views on Vision4Press platform.
Data correspond to usage on the plateform after 2015. The current usage metrics is available 48-96 hours after online publication and is updated daily on week days.
Initial download of the metrics may take a while.