Open Access
Fig. 4
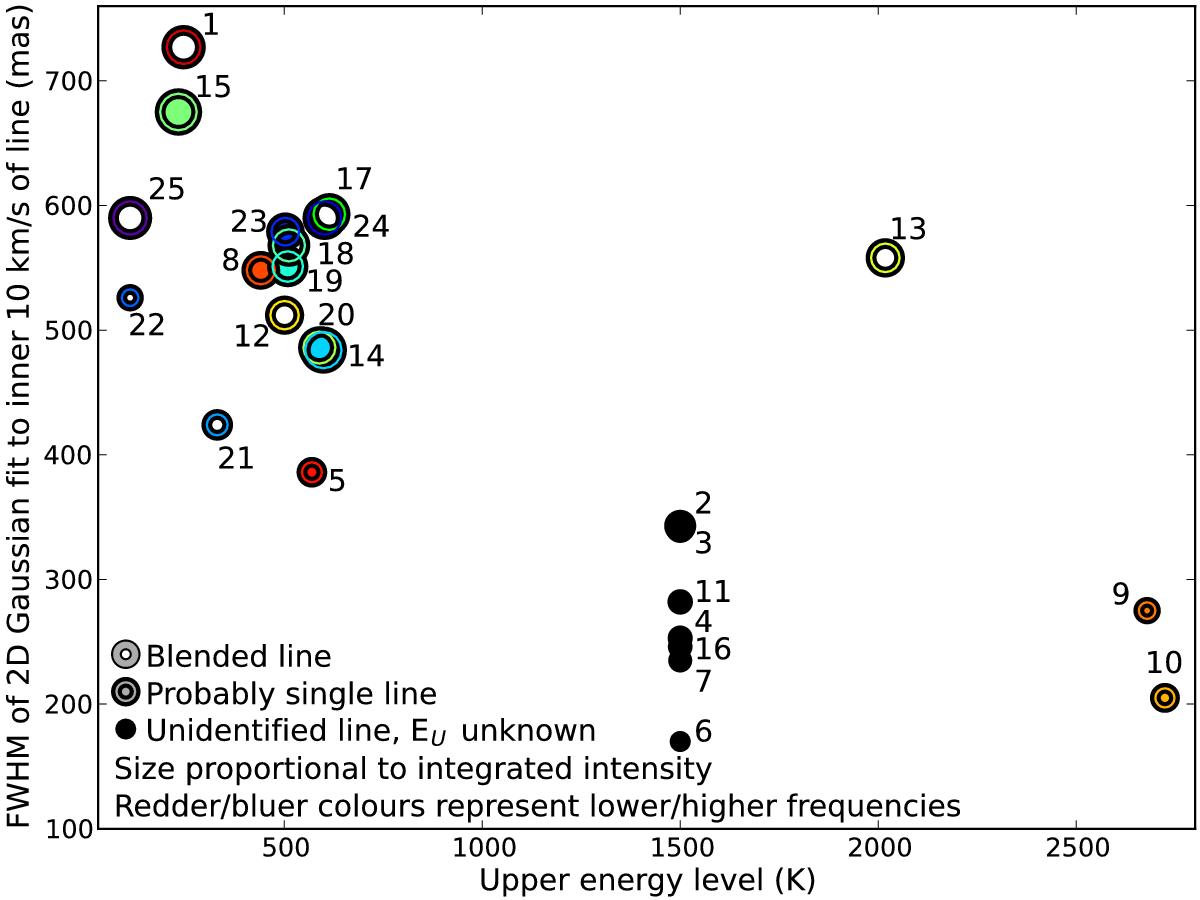
Spatial FWHM as a function of the upper state energy level. Lines are identified by their number given in Col. 1 of Table 1. The size of the symbols is proportional to the integrated intensity; unidentified lines are placed at an artifical upper state energy of 1500 K.
Current usage metrics show cumulative count of Article Views (full-text article views including HTML views, PDF and ePub downloads, according to the available data) and Abstracts Views on Vision4Press platform.
Data correspond to usage on the plateform after 2015. The current usage metrics is available 48-96 hours after online publication and is updated daily on week days.
Initial download of the metrics may take a while.