Fig. 3
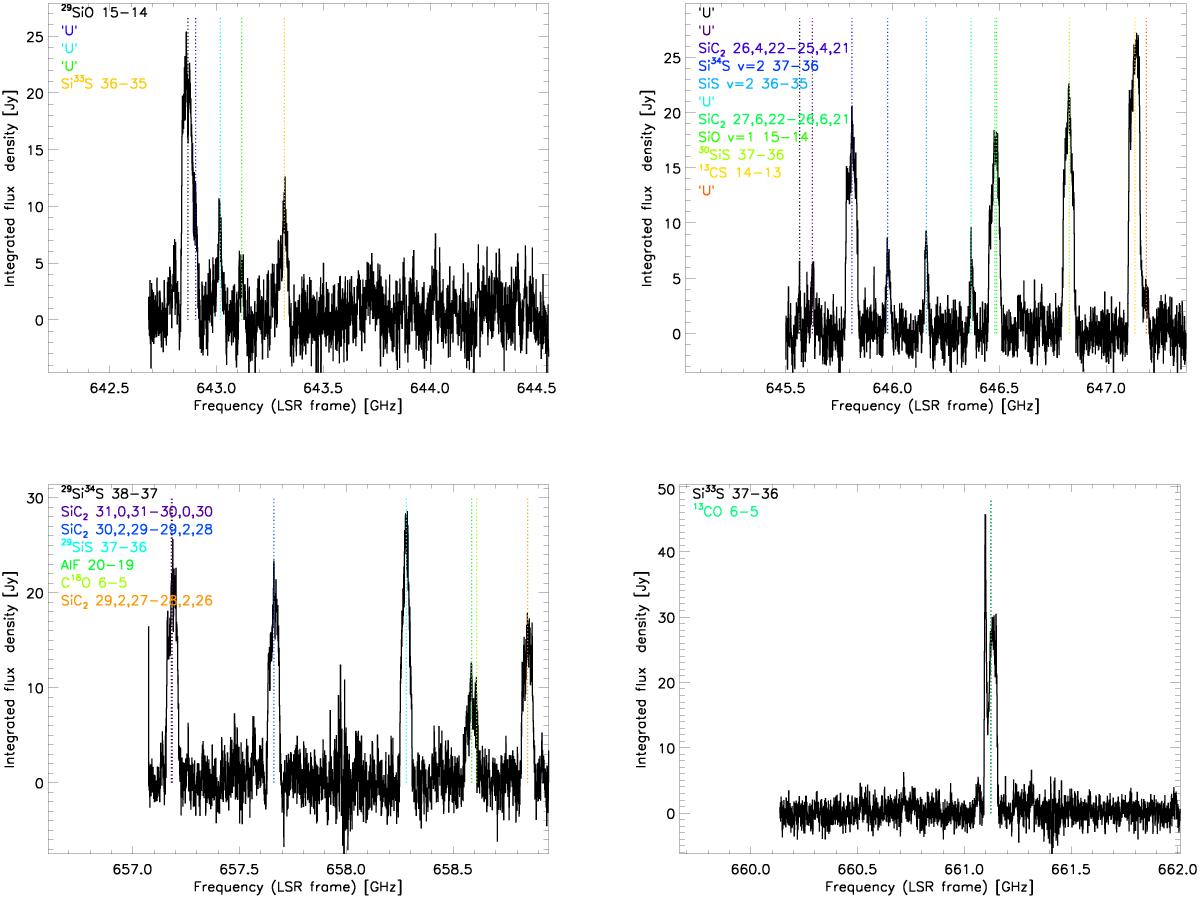
Integrated flux density of the four spectral setups extracted in a circle of 1.2′′ in radius centred on the continuum peak. The molecular lines are indicated in colour; unidentified lines are marked as “U”. Note that the noise around 658 GHz is due to the strong atmospheric opacities at this frequency. The frequency values are corrected for the Earth’s motion.
Current usage metrics show cumulative count of Article Views (full-text article views including HTML views, PDF and ePub downloads, according to the available data) and Abstracts Views on Vision4Press platform.
Data correspond to usage on the plateform after 2015. The current usage metrics is available 48-96 hours after online publication and is updated daily on week days.
Initial download of the metrics may take a while.