Fig. 18
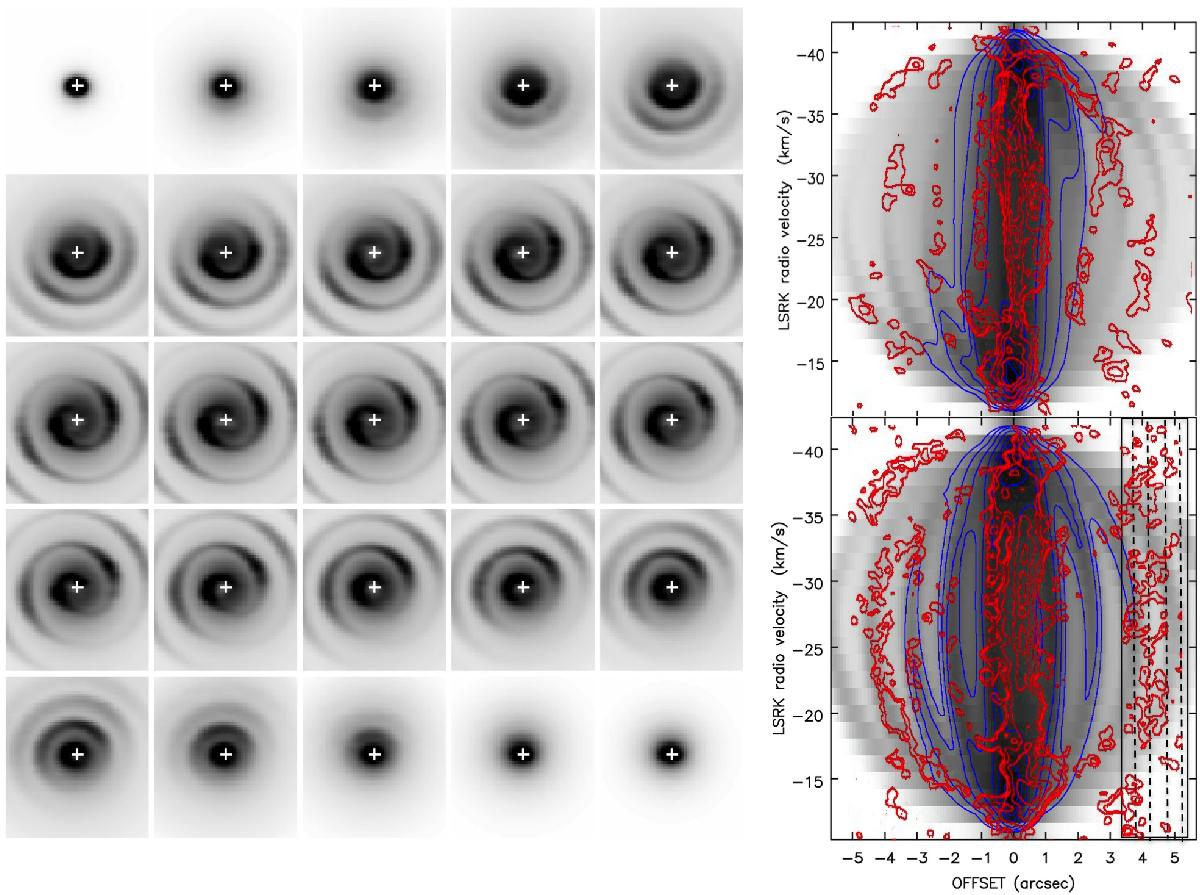
Left: simulated channel maps for a spiral wind structure with parameters a = 1.12, p = 2, b = 0, c = 3 × 1012 cm, w = 30°, and i = 60°, including a smooth wind structure with a spiral/wind density contrast of a factor 4. The central velocity of the panel at the top left is −16 km s-1 (w.r.t. vLSR), at the bottom right corner +16 km s-1, hence Δv is 1.33 km s-1 for adjacent panels. The field of view is 5′′× 5′′. The ALMA instrumental effects are not taken into account in this simulation. Right: corresponding simulated PV diagrams (in grey-scale) for a slit along the declination axis (top) and along the right ascension axis (bottom). The contours of the simulated PV diagrams are shown in blue and for the ALMA data in red, each time at (0.05, 0.1, 0.2, 0.4, 0.6, 0.8) times the highest intensity. The shaded region in the bottom panel indicates the place where sidelobe effects deteriorate the quality of the ALMA PV data.
Current usage metrics show cumulative count of Article Views (full-text article views including HTML views, PDF and ePub downloads, according to the available data) and Abstracts Views on Vision4Press platform.
Data correspond to usage on the plateform after 2015. The current usage metrics is available 48-96 hours after online publication and is updated daily on week days.
Initial download of the metrics may take a while.