Fig. 14
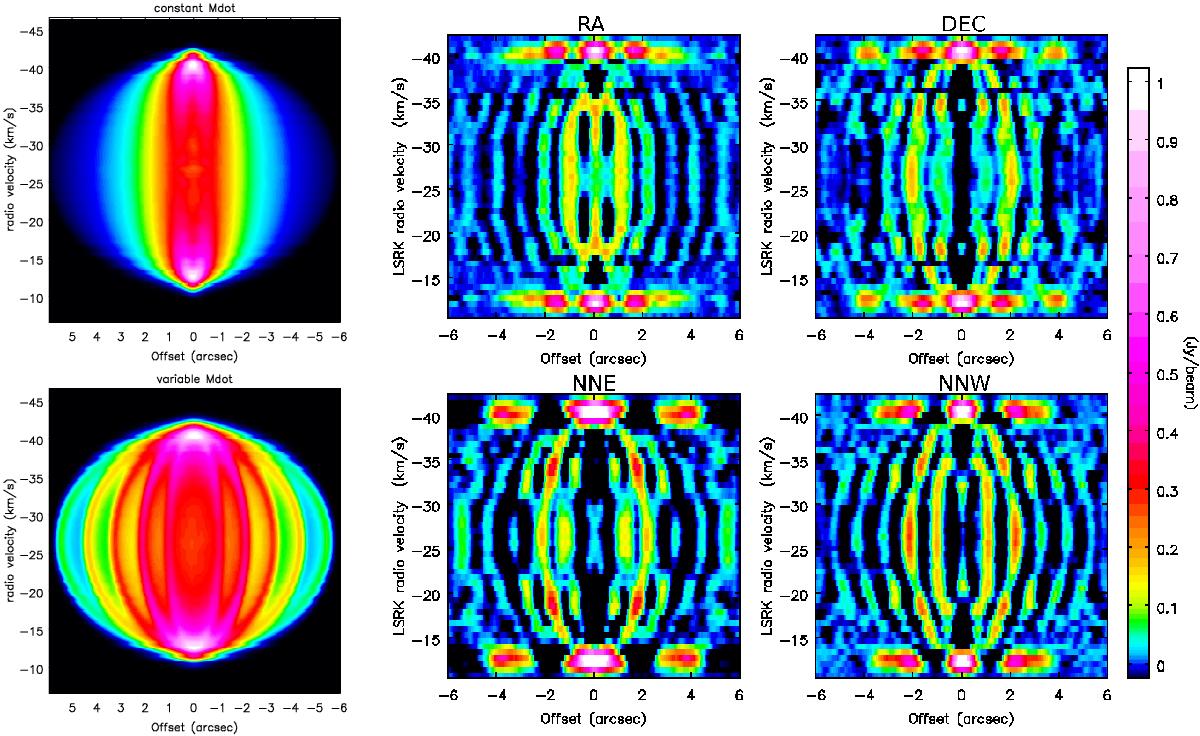
Simulated 13CO J = 6–5 PV diagrams for a beam of 0.̋43 × 0.̋23. Top left: model for radially outflowing wind for a constant mass-loss rate (ρ ∝ r-2). Bottom left: model for a radial outflowing wind with varying wind density, with the shell-intershell density contrast being 10. The density-enhanced shells are placed with an interval of 1′′. No instrumental effects were taken into account. Right: simulations for the PV-diagram for the density-enhanced shells taking the ALMA instrumental effects into account: in the four sub-panels, the slit is varied to create a PV diagram along the right ascension coordinate, the declination coordinate, and 22.5° to the north-east (NNE) or to the north-west (NNW).
Current usage metrics show cumulative count of Article Views (full-text article views including HTML views, PDF and ePub downloads, according to the available data) and Abstracts Views on Vision4Press platform.
Data correspond to usage on the plateform after 2015. The current usage metrics is available 48-96 hours after online publication and is updated daily on week days.
Initial download of the metrics may take a while.