Fig. 10
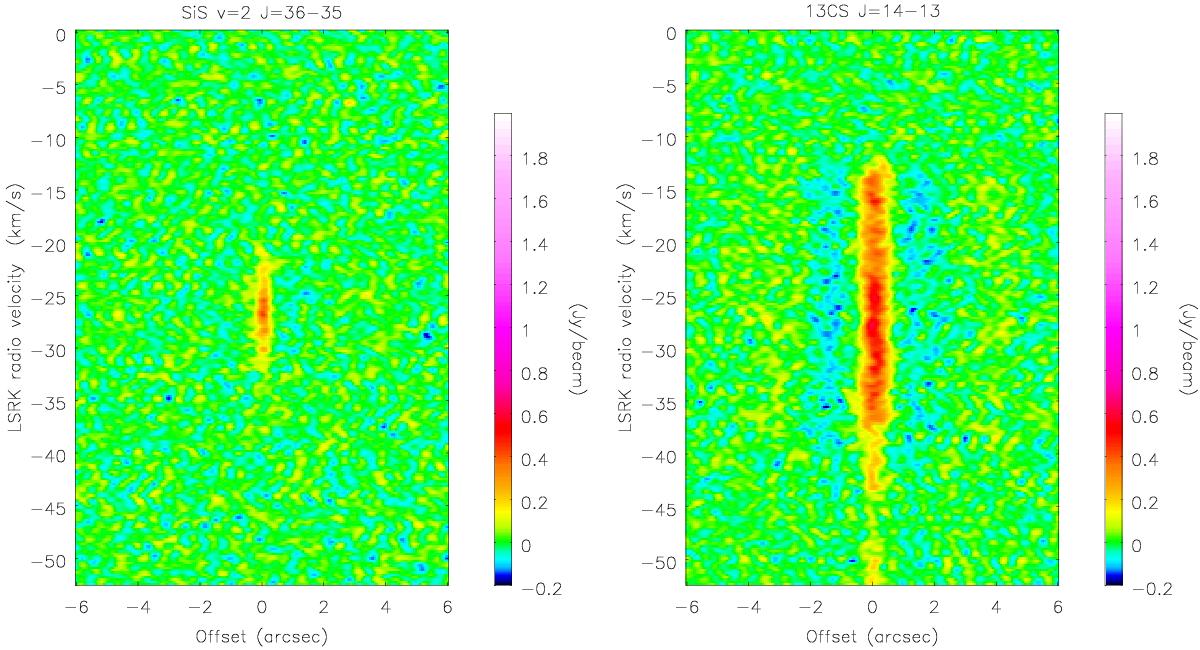
Position-velocity diagram in right ascension for SiS v = 2J = 36–35 at 646.100 GHz (left) and 13CS J = 14–13 at 647.076 GHz (right). Note that an offset to the east is negative, and to the west positive. Sidelobe-effects are seen in the right image, as well as the fact that the 13CS J = 14–13 line is blended in the blue wing with a “U”-line.
Current usage metrics show cumulative count of Article Views (full-text article views including HTML views, PDF and ePub downloads, according to the available data) and Abstracts Views on Vision4Press platform.
Data correspond to usage on the plateform after 2015. The current usage metrics is available 48-96 hours after online publication and is updated daily on week days.
Initial download of the metrics may take a while.