Fig. 9
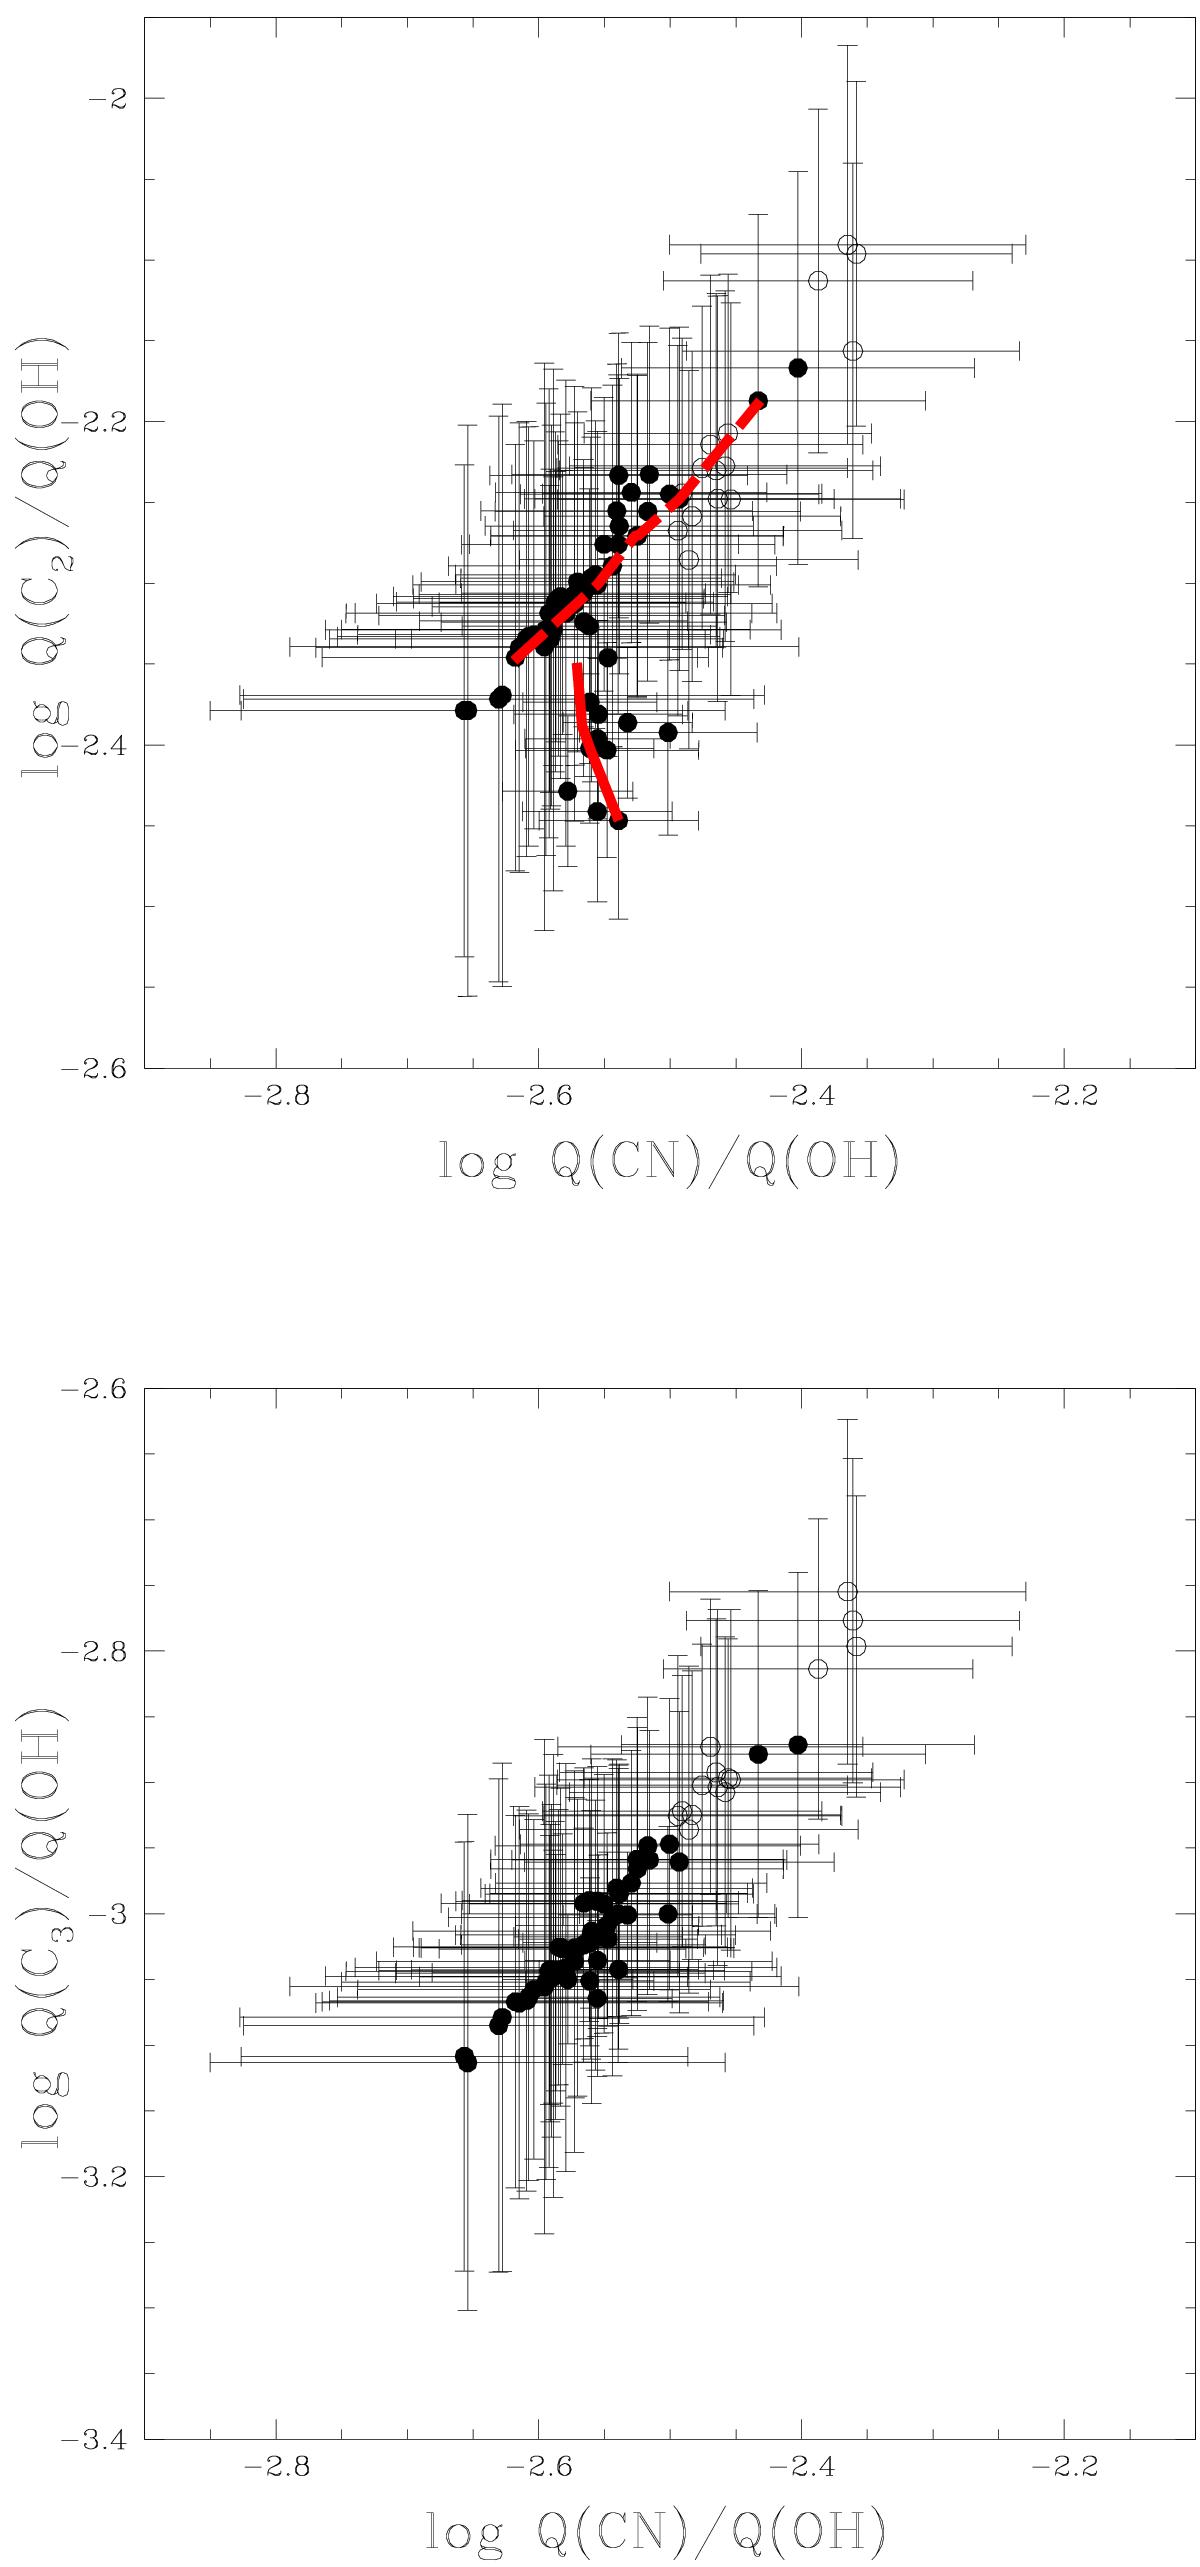
Logarithm of the ratio of C2 (top) and C3 to OH production against logarithm of the ratio of CN to OH and their error bars. Pre-perihelion values are represented with filled symbols and post-perihelion values with open symbols. The solid red line indicates the evolution of comet Lemmon between December 11 and January 13 and the dashed line between February 7 and March 4.
Current usage metrics show cumulative count of Article Views (full-text article views including HTML views, PDF and ePub downloads, according to the available data) and Abstracts Views on Vision4Press platform.
Data correspond to usage on the plateform after 2015. The current usage metrics is available 48-96 hours after online publication and is updated daily on week days.
Initial download of the metrics may take a while.