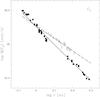
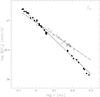
Fig. 3
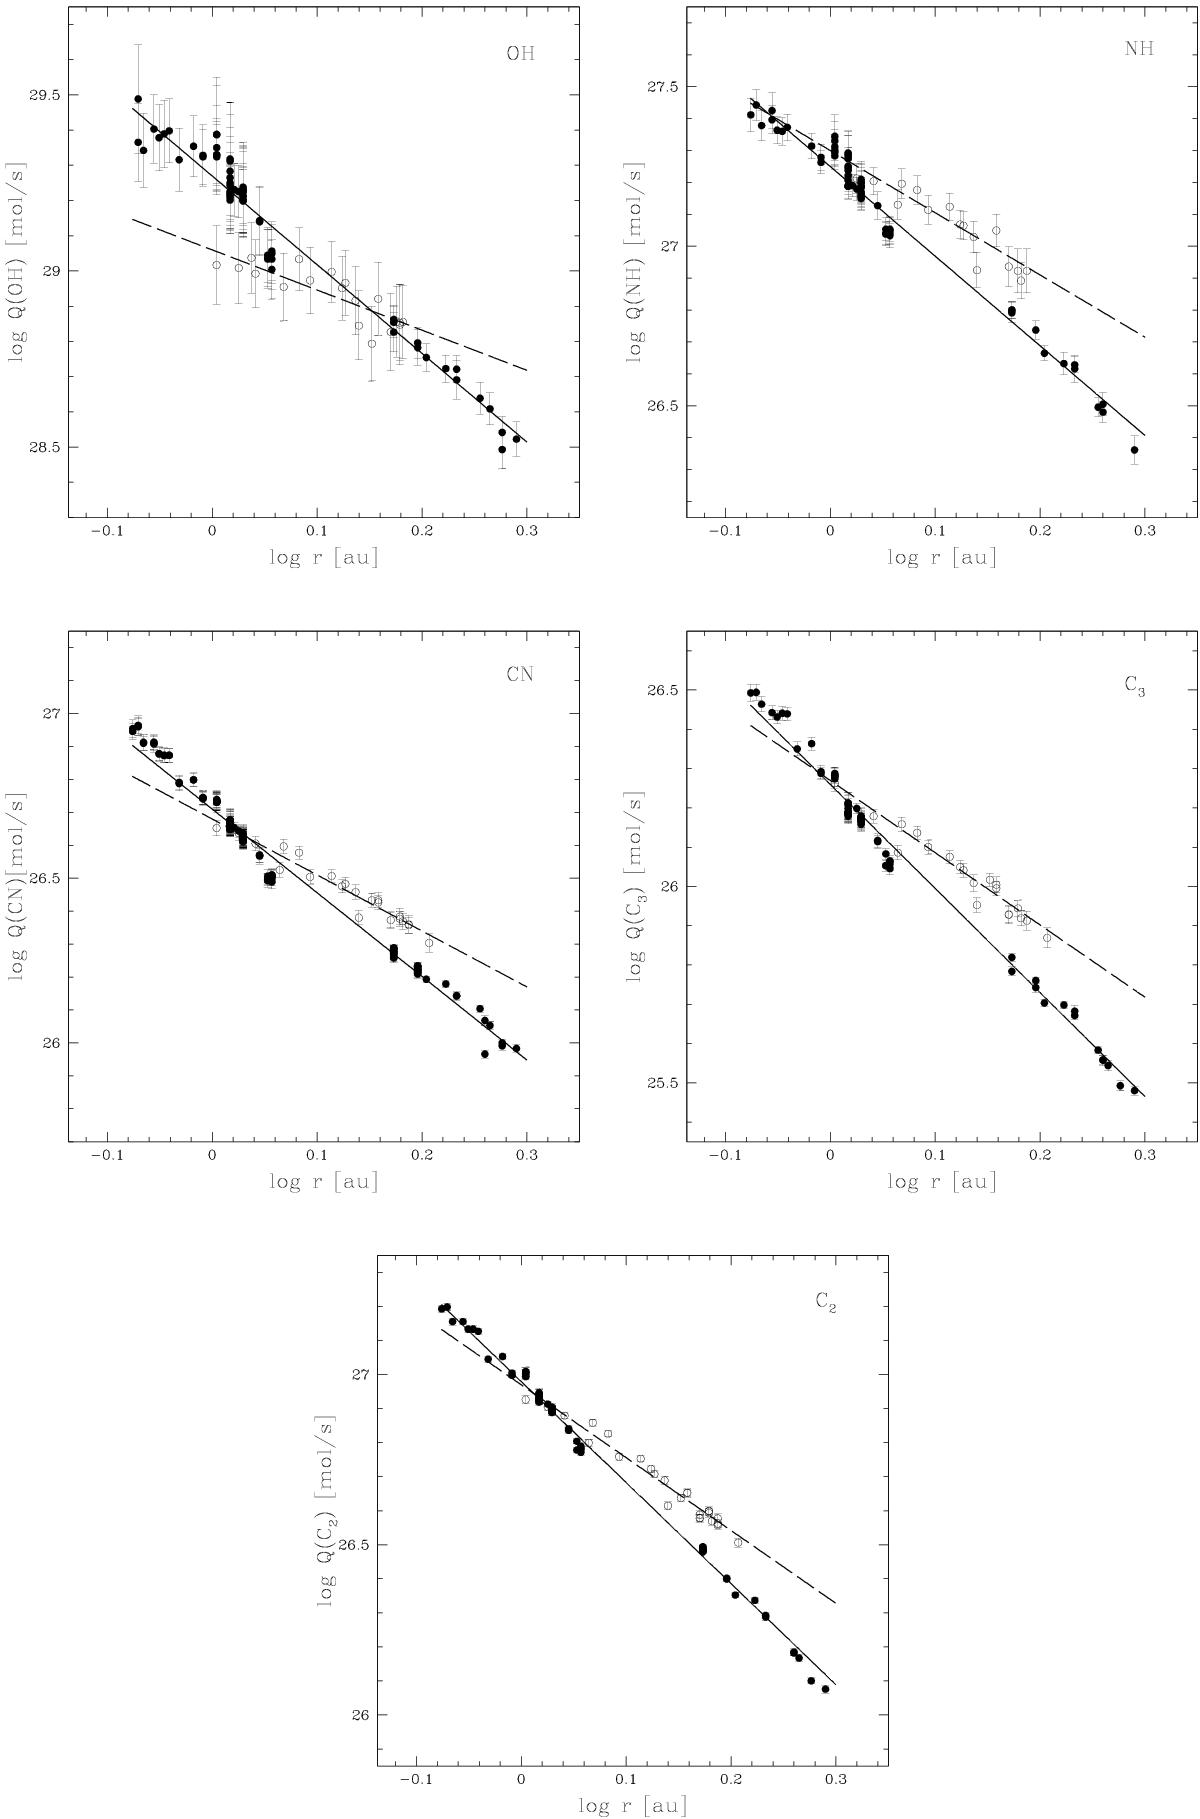
Logarithm of OH, NH, CN, C3, and C2 production rates of C/2012 F6 (Lemmon) as a function of the logarithm of the heliocentric distance (r). Pre-perihelion data points are represented with filled symbols and post-perihelion data points are represented with open symbols. The origin of the x-axis is perihelion. Solid lines are linear fits of the production rates variation with the pre-perihelion heliocentric distance. Dotted lines are the same for post-perihelion values.
Current usage metrics show cumulative count of Article Views (full-text article views including HTML views, PDF and ePub downloads, according to the available data) and Abstracts Views on Vision4Press platform.
Data correspond to usage on the plateform after 2015. The current usage metrics is available 48-96 hours after online publication and is updated daily on week days.
Initial download of the metrics may take a while.