Fig. 14
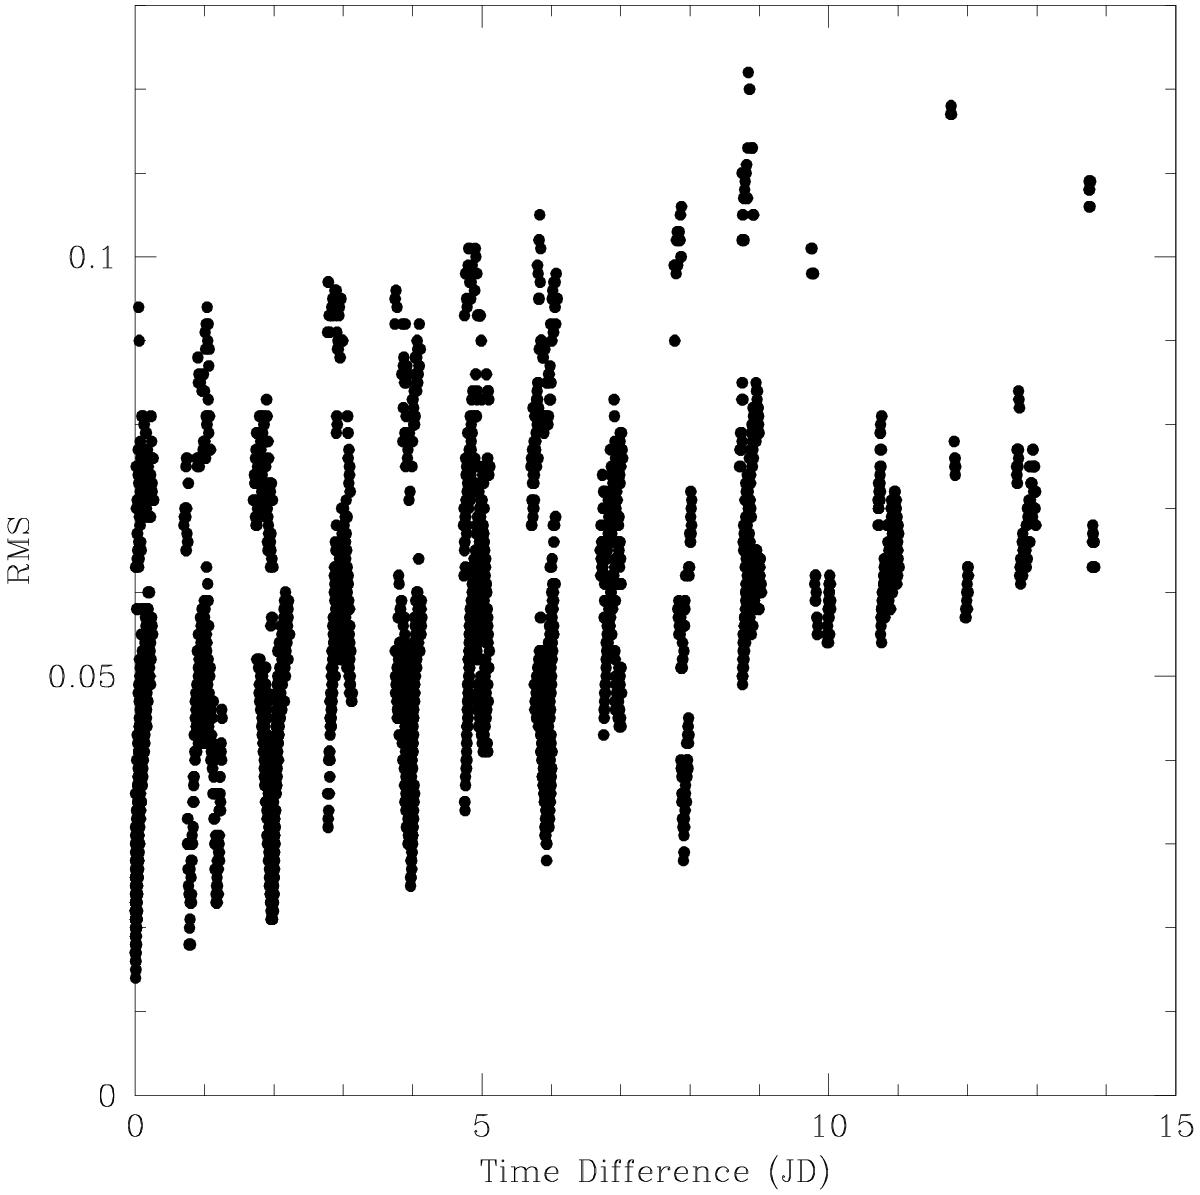
Result of C/2012 F6 (Lemmon) rotation analysis. CN images from February 9 to February 25 have been normalized and divided between each other. We plot the RMS resulting from each division as a function of the time difference between the images. Minima in the RMS repeat with the nucleus rotation period. We measured a period of 9.52 ± 0.05 h from 13 matching pairs between February 9 and February 25.
Current usage metrics show cumulative count of Article Views (full-text article views including HTML views, PDF and ePub downloads, according to the available data) and Abstracts Views on Vision4Press platform.
Data correspond to usage on the plateform after 2015. The current usage metrics is available 48-96 hours after online publication and is updated daily on week days.
Initial download of the metrics may take a while.