Fig. 3
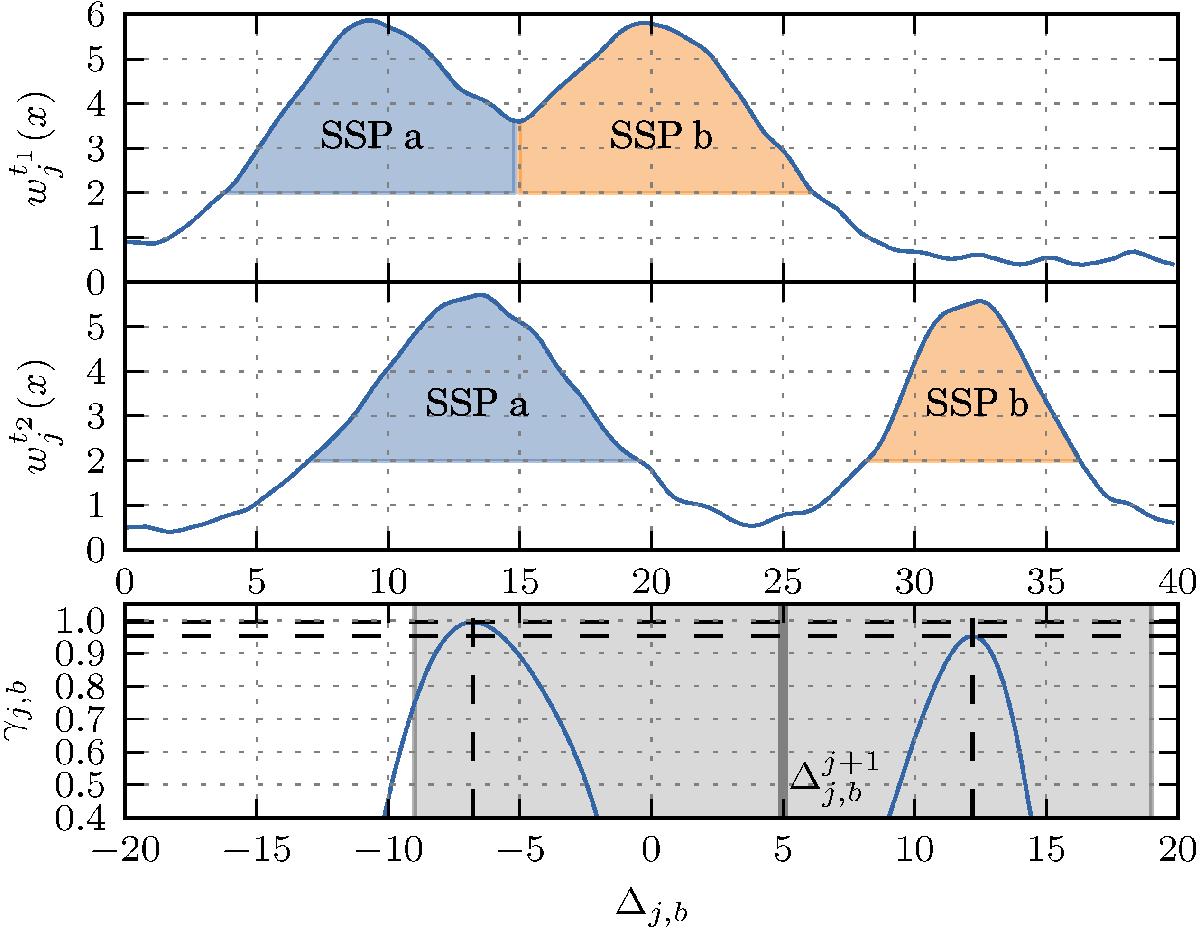
Schematic illustration of the detection method used for displacement measurements in a one-dimensional case. In the upper two panels the wavelet decomposition at a scale j of the reference (top panel) and target image is plotted, with two detected SSP marked with colors and letters. The x-axis of each panel is given in pixels. The result of WZNCC between SSP b and the target image is plotted below in the third panel. Two potential displacements are identified within the bounds (gray area) defined by Eq. (9)and the initial displacement guess ![]() obtained from analysis at scale j + 1. To select the correct one and to reduce the chance for erroneous cross-correlation, the group motion of causally connected SSP (in this case SSP a and SSP b) is also included in the cross-correlation analysis, which results in the identification of the displacement Δj,b = 12.
obtained from analysis at scale j + 1. To select the correct one and to reduce the chance for erroneous cross-correlation, the group motion of causally connected SSP (in this case SSP a and SSP b) is also included in the cross-correlation analysis, which results in the identification of the displacement Δj,b = 12.
Current usage metrics show cumulative count of Article Views (full-text article views including HTML views, PDF and ePub downloads, according to the available data) and Abstracts Views on Vision4Press platform.
Data correspond to usage on the plateform after 2015. The current usage metrics is available 48-96 hours after online publication and is updated daily on week days.
Initial download of the metrics may take a while.