Fig. 10
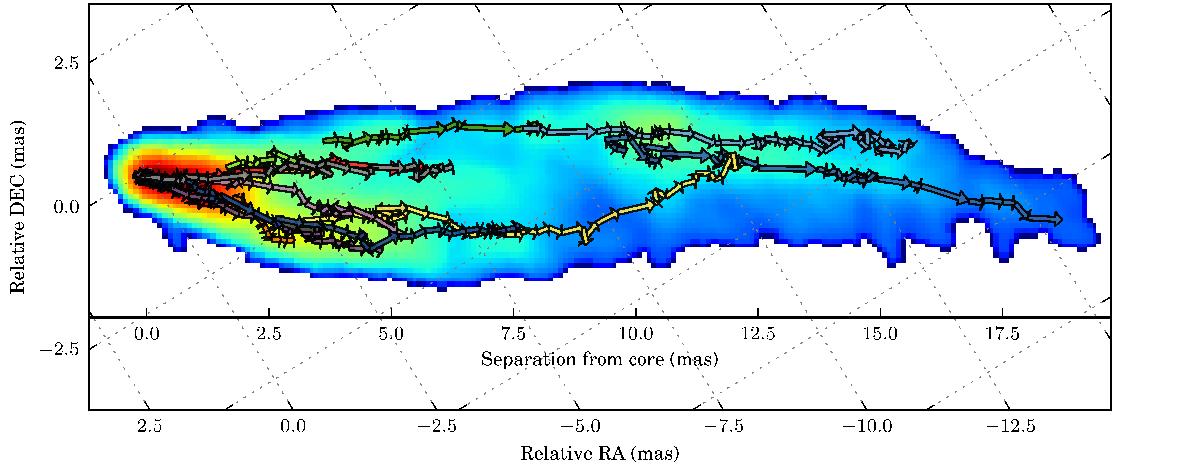
Two-dimensional tracks of the SSP detected by WISE at scales 3–4 of the SWD and compared in Fig. 11 with the features identified in the MOJAVE analysis of the images. The tracks are overplotted on a stacked-epoch image of the jet rotated by an angle of 0.55 radian. Colors distinguish individual SSP continuously tracked over certain period of time. Several generic “flow lines” are clearly visible in the jet. These patterns are difficult to detect with the standard Gaussian model fitting analysis. The image is rotated.
Current usage metrics show cumulative count of Article Views (full-text article views including HTML views, PDF and ePub downloads, according to the available data) and Abstracts Views on Vision4Press platform.
Data correspond to usage on the plateform after 2015. The current usage metrics is available 48-96 hours after online publication and is updated daily on week days.
Initial download of the metrics may take a while.