Fig. 1
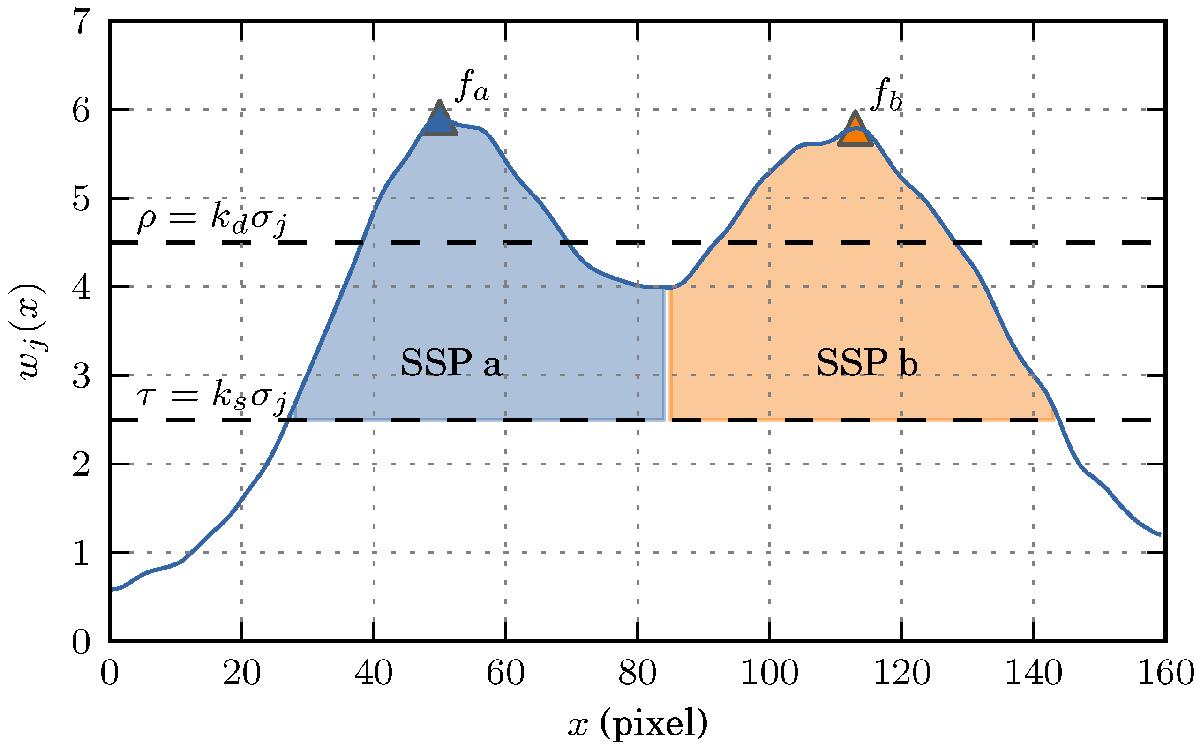
Schematic illustration of the method used for SSP localization, applied to a one-dimensional case. The local maxima (triangle marker) are located using the maximum filter and the SSP are associated with each of the local maxima by applying the watershed flooding algorithm. In this example the SSP “a” associated with the position fa is defined by a region between 25 pix and 82 pix.
Current usage metrics show cumulative count of Article Views (full-text article views including HTML views, PDF and ePub downloads, according to the available data) and Abstracts Views on Vision4Press platform.
Data correspond to usage on the plateform after 2015. The current usage metrics is available 48-96 hours after online publication and is updated daily on week days.
Initial download of the metrics may take a while.