Fig. 6
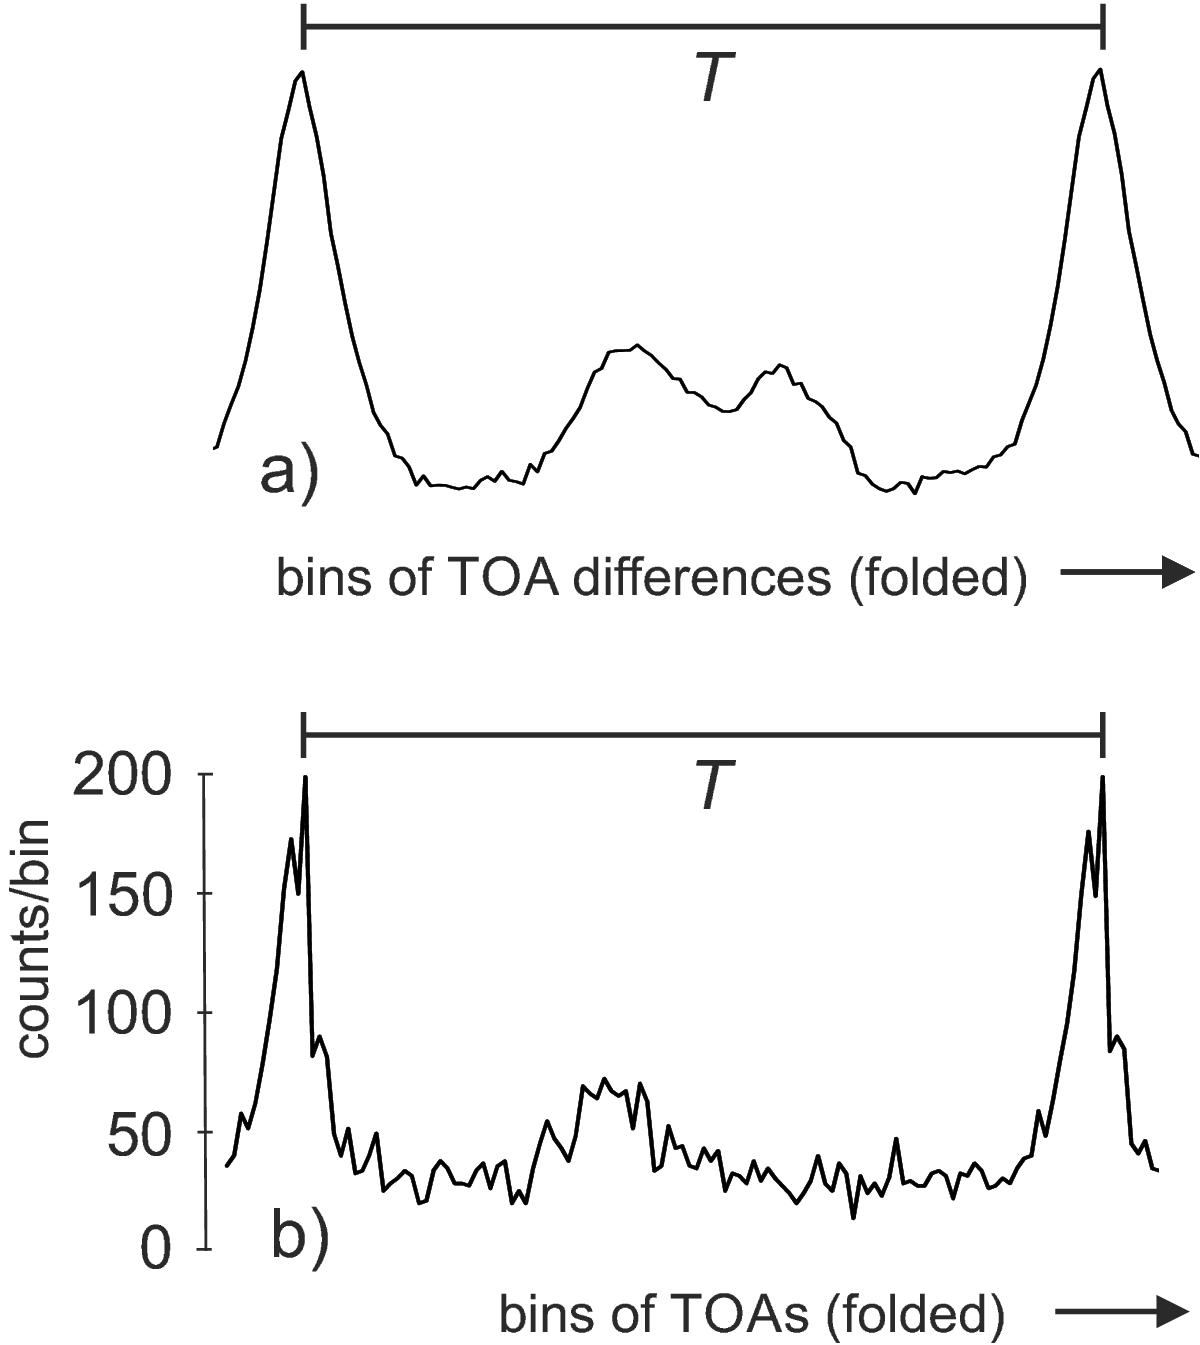
a) Autocorrelation of the optical pulsar flux obtained by piecewise superimposing the envelope of the histogram of Fig. 5; b) detected optical flux versus time, as obtained by folding all the periods of the observing run and taking the average. The detected photon time series were identical for a) and b), and the pulsar period T was divided into 112 bins in both cases. Clearly, method a) provided the better signal-to-noise ratio. (TOA ... time of arrival of photons).
Current usage metrics show cumulative count of Article Views (full-text article views including HTML views, PDF and ePub downloads, according to the available data) and Abstracts Views on Vision4Press platform.
Data correspond to usage on the plateform after 2015. The current usage metrics is available 48-96 hours after online publication and is updated daily on week days.
Initial download of the metrics may take a while.