Free Access
Fig. 3
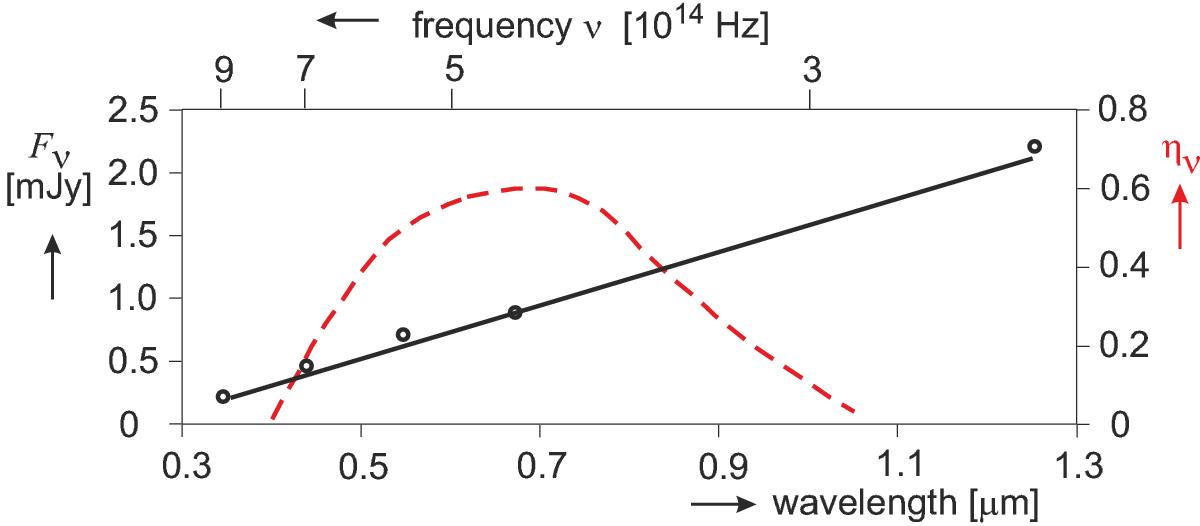
Observed flux density Fν of the Crab pulsar (left ordinate). The circles are the measured values reported by Eikenberry et al. (1997), and the full line the (linear) approximation used in this paper. The dashed line gives the typical quantum efficiency ην of detectors (right ordinate).
Current usage metrics show cumulative count of Article Views (full-text article views including HTML views, PDF and ePub downloads, according to the available data) and Abstracts Views on Vision4Press platform.
Data correspond to usage on the plateform after 2015. The current usage metrics is available 48-96 hours after online publication and is updated daily on week days.
Initial download of the metrics may take a while.