Free Access
Fig. 8
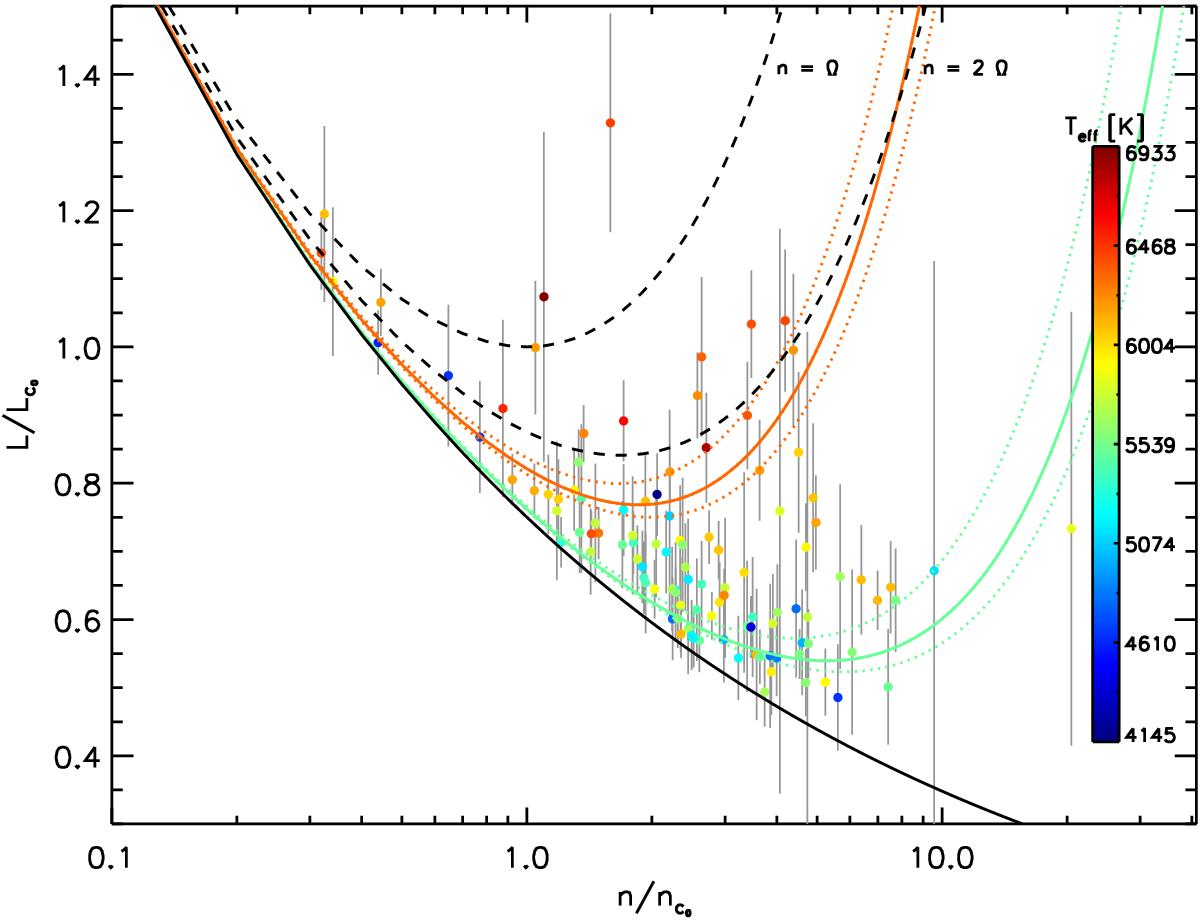
Same as Fig. 7, but the colour of the symbols indicates the effective temperature of the star. The colours of the solid lines give the mean effective temperature of the stars of both subsamples. The 90% confidence interval is given by the dotted lines of the respective colours.
Current usage metrics show cumulative count of Article Views (full-text article views including HTML views, PDF and ePub downloads, according to the available data) and Abstracts Views on Vision4Press platform.
Data correspond to usage on the plateform after 2015. The current usage metrics is available 48-96 hours after online publication and is updated daily on week days.
Initial download of the metrics may take a while.