Fig. 7
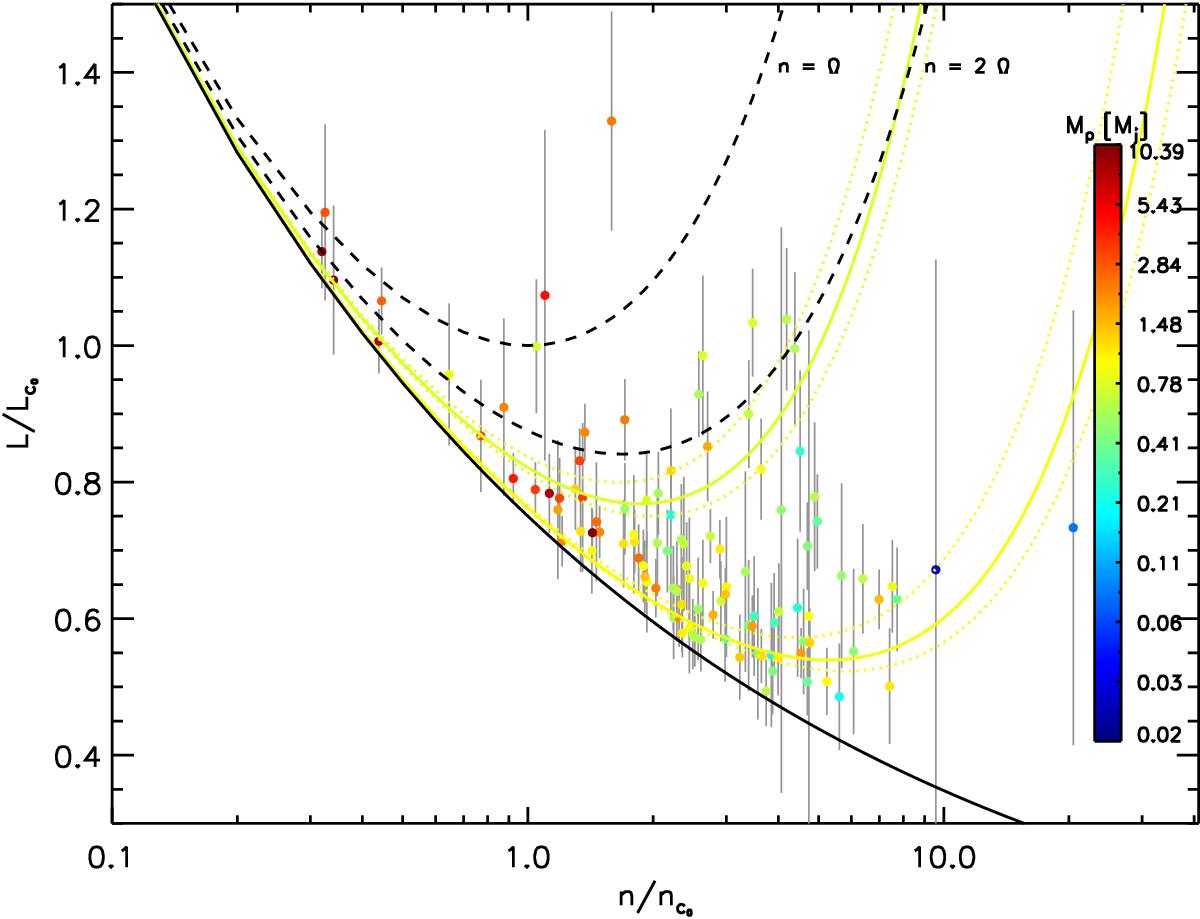
Same as Fig. 3, but the colour of the symbols indicates the mass of the planet. The dashed black lines indicate the loci where n = Ω and n = 2Ω as labelled. The solid black line is, for a given orbit, the contribution of the orbital angular momentum to the total momentum. The solid coloured lines are the best fits for the stationary locus for planets with Mp ≤ 1MJ orbiting either stars with Teff ≥ 6250 or Teff< 6000 K. Their colours correspond to the average planetary mass of the respective subsamples. The 90% confidence interval is given by the dotted lines of the respective colours.
Current usage metrics show cumulative count of Article Views (full-text article views including HTML views, PDF and ePub downloads, according to the available data) and Abstracts Views on Vision4Press platform.
Data correspond to usage on the plateform after 2015. The current usage metrics is available 48-96 hours after online publication and is updated daily on week days.
Initial download of the metrics may take a while.