Fig. 5
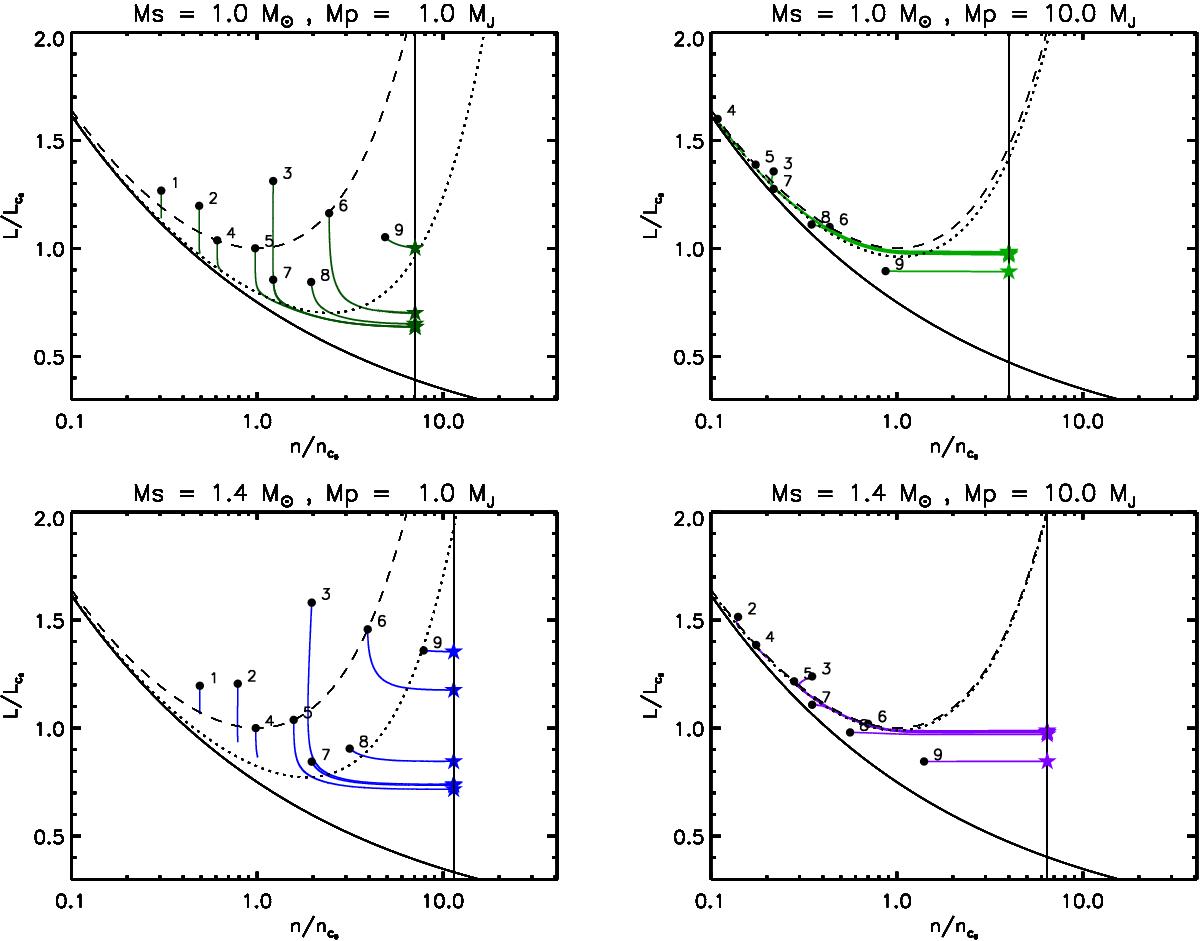
Darwin diagram showing the evolution of the angular momentum of planetary systems under the action of both tidal dissipation and magnetic braking. The evolutionary tracks are shown in different colours for different combinations of stellar and planetary mass. Models include a solar-like star (top) or an F-type star (bottom) and a Jupiter mass (left) or 10 times the mass of Jupiter (right) planet. The black dashed line is the locus of synchronization Ω = n, while the dotted line is the locus of balance between the rate of AML due to the wind and the rate of AM transfer with the orbit (![]() ). The solid black vertical line gives the Roche limit where the computation stops. Different initial conditions are indicated by numbers corresponding to their sets as listed in Table 3. The end of the evolutionary track is symbolized by a star for the planets that reach the Roche limit in less than 13 Gyr.
). The solid black vertical line gives the Roche limit where the computation stops. Different initial conditions are indicated by numbers corresponding to their sets as listed in Table 3. The end of the evolutionary track is symbolized by a star for the planets that reach the Roche limit in less than 13 Gyr.
Current usage metrics show cumulative count of Article Views (full-text article views including HTML views, PDF and ePub downloads, according to the available data) and Abstracts Views on Vision4Press platform.
Data correspond to usage on the plateform after 2015. The current usage metrics is available 48-96 hours after online publication and is updated daily on week days.
Initial download of the metrics may take a while.