Fig. 1
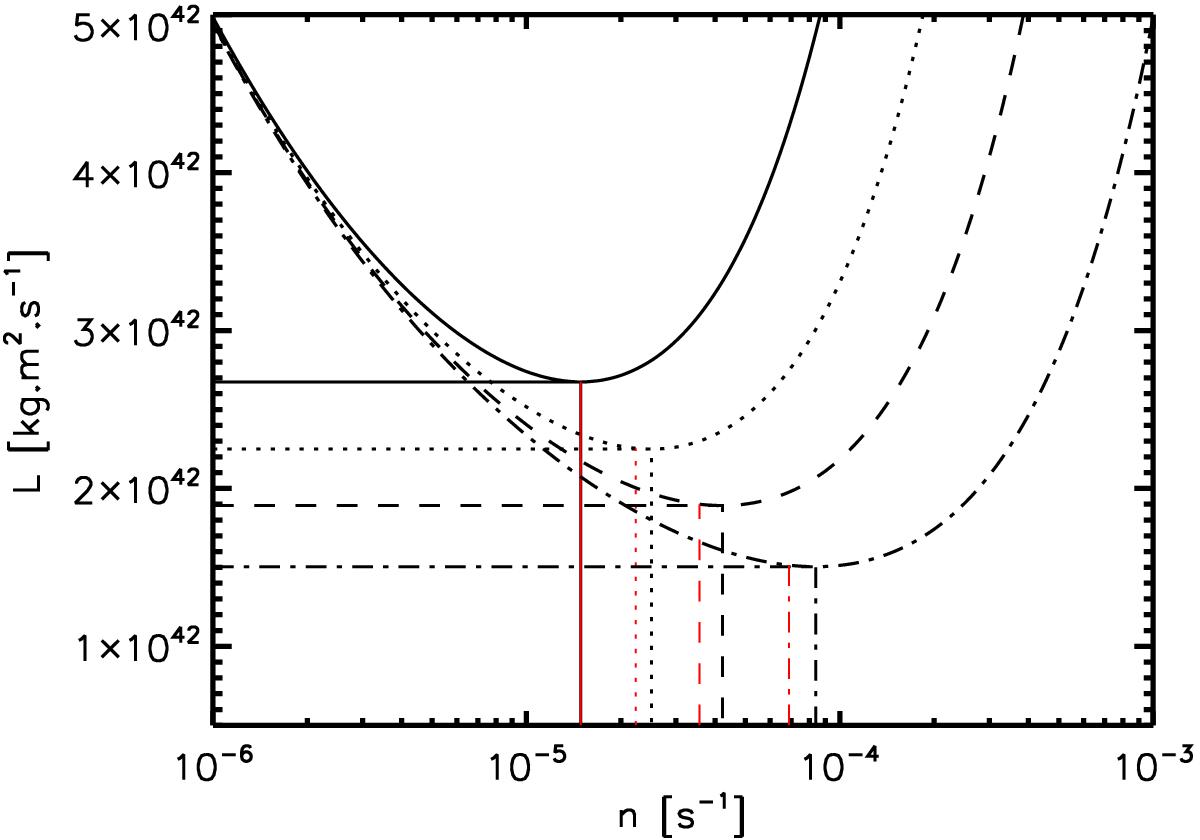
Quasi-co-rotation curves given by Eq. (42)for different values of β, from top to bottom β = 1, 0.5, 0.25, and 0.1. The critical values Lc and nc are indicated by vertical and horizontal black lines whose linestyle corresponds to the different values of β. The red vertical lines indicate the value of ns, again with the linestyle corresponding to the different values of β. On each plot, the quasi-co-rotation condition corresponds to a pseudo-stable equilibrium for n<ns (i.e. on the part of the curve on the left of the red line n = ns), provided that the wind torque dominates the tidal torque. The numerical values correspond to a 1 M⊙ star and a 1 MJ planet.
Current usage metrics show cumulative count of Article Views (full-text article views including HTML views, PDF and ePub downloads, according to the available data) and Abstracts Views on Vision4Press platform.
Data correspond to usage on the plateform after 2015. The current usage metrics is available 48-96 hours after online publication and is updated daily on week days.
Initial download of the metrics may take a while.