Fig. 6
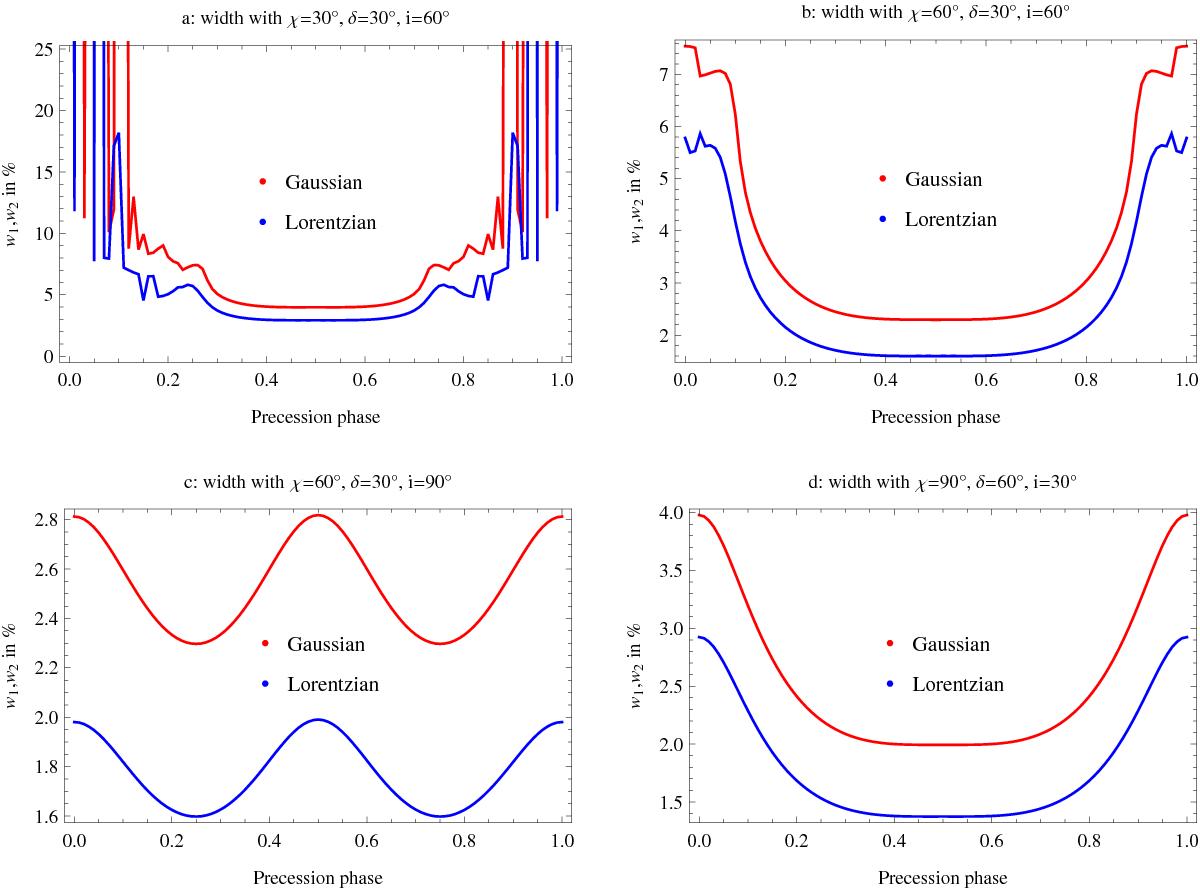
Evolution of the pulse width (w1,w2) with respect to the precession phase ϕ. The two fitting models are shown, Gaussian in red and Lorentzian in blue. For the first plot (panel a)) significant emission occurs only in the phase interval φ ∈ [0.2,0.8]. This is because the line of sight does not intersect the high-energy beam anymore. The plot outside this range is therefore irrelevant.


Current usage metrics show cumulative count of Article Views (full-text article views including HTML views, PDF and ePub downloads, according to the available data) and Abstracts Views on Vision4Press platform.
Data correspond to usage on the plateform after 2015. The current usage metrics is available 48-96 hours after online publication and is updated daily on week days.
Initial download of the metrics may take a while.