Fig. 5
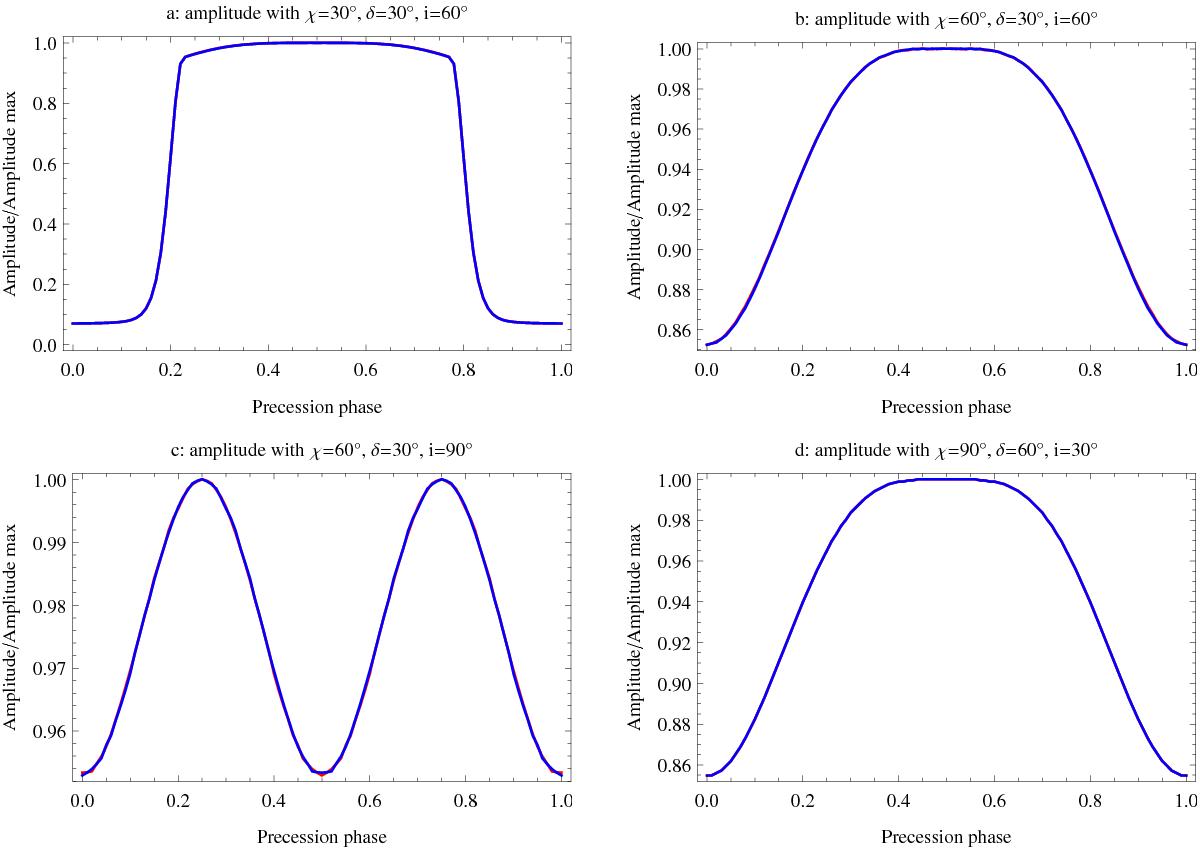
Simulated evolution of the highest peak amplitude Imax with respect to a full precession period with phase ϕ ∈ [0,2 π]. The geometrical parameters are shown in the titles. The two fitting models are shown, Gaussian in red and Lorentzian in blue. Both fits overlap almost perfectly. The highest intensity does not depend on the fitting profile, as expected. The intensity contrast can reach 10 for panel a) and be rather weak for other configurations, such as panel c), which shows a variation of only 5%.
Current usage metrics show cumulative count of Article Views (full-text article views including HTML views, PDF and ePub downloads, according to the available data) and Abstracts Views on Vision4Press platform.
Data correspond to usage on the plateform after 2015. The current usage metrics is available 48-96 hours after online publication and is updated daily on week days.
Initial download of the metrics may take a while.